Blogs


Welcome to Project Controls Institute, Australia blog.

Selection of thoughts and tips shared by Project Controls community.

test

How to modify Activity ID Suffix in Primavera P6


7

In Primavera we can use ‘Renumbering Activity ID” function to modify Activity ID Prefix. How about we want to modify Suffix.

I will show you how.

We have a simple project with default activity ID like this

1

First we go to Tool -> Global Change

Click on New button

3

In “Then” section:

  • In Parameter select “Activity ID”
  • In Parameter/Value select “Activity ID”
  • In Operator select “&”
  • In Parameter/Value select “Custom”

3

Then enter the Suffix you want to add. For example “FDN”

4

Click on “Change” button.

6

P6 will show you a preview of the change. Click on “Commit Changes” button.

Now you can see there is “FDN” letter in your Activity ID.

Tags:
14
Continue reading
9732 Hits
0 comments

Critical path: Total Float vs Longest Path


First, let’s take a look at the location of the settings for these two options in Primavera P6 Professional.

Critical Activity Definitions

Go to the Projects view of you Primavera P6 Professional application, select a project and then click on the Settings tab in the bottom layout.

TheLongestPath_001

You’ll see the default setting for defining critical activities in the area imaginatively named “Define Critical Activities”, in the lower area of the Settings tab.

This is the default behavior that will be offered to the scheduler when running the Schedule function.

However, this can be overridden at any time in the Schedule Options dialog, accessible from the Schedule dialog (accessed by clicking the F9 key or selecting Schedule from the Tools menu).

TheLongestPath_002

In here you select the Total Float less than or equal to [value in hours] or go with Longest Path.

TheLongestPath_003

Total Float vs. Longest Path

The difference between Total Float and Longest Path can be summed up in the following way. Total Float calculations look at the Total Float for each activity in the network. If its Total Float value is zero, then it will be flagged as a critical activity. However that doesn’t necessarily mean the activity is on the longest path; it just tells us that the activity is critical, and it may be so due to other factors.

The following example shows how the critical path appears when the Total Float method is used to calculate the Critical Path. Activity A1050 has a ‘Finish On or Before’ constraint that is equal to its planned finish date, so it and its predecessors are showing critical. If they slip, they probably won’t impact the end date of the project, but they will overrun their constraint date; which is why they are showing as critical from a ‘Total Float <= 0’ perspective.

TheLongestPath_004

However,  if the Longest Path method of calculation is used these same activities will not appear as critical because there is a constraint somewhere along that path.  They will not in this case affect the end date of the project, so they are not on the longest path.

In this next example you can see the identical project schedule when it is calculated using the Longest Path method.

TheLongestPath_005

Previously critical activities are now showing as non-critical. Interestingly, they still have zero days Total Float, but P6 is ignoring them because they are not part of the longest path through the network.

The Longest Path through the schedule network will only consider activities as critical if they are on a contagious path from the start of the project to the end. Typically this is a single path upon which any activity that slips will impact the end date of the project.

Usage

Schedulers often use the Longest Path method when first developing the schedule. This gives them a clear idea of the activities that are driving the scheduled finish date for the overall project, without concerning themselves with complicating factors such as constraints, resource leveling, path divergence and convergence and other items that come into play when working a large and complex schedule.

Primavera P6 even has a “Longest Path” Boolean field that allows you to create a filter to see only activities on the longest path.

TheLongestPath_006

The Critical column and the Longest Path column will hold different values once a calculation of each type has been performed on the schedule at least one time.

TheLongestPath_007

With Primavera P6, you’re not committed to one method or another. At any time during the project lifecycle you can switch from Total Float to Longest Path depending on what you need to see. And at any time you can report on one or the other methods by using the Critical and Longest Path column values.

Source : https://tensix.com/2014/04/the-longest-path/

Tags:
22
Continue reading
44080 Hits
0 comments

Primavera become slow – Limitations of SQL Server Express Edition

Primavera become slow – Limitations of SQL Server Express Edition

1
 

A lot of people are using Primavera with SQL Express database. And after using Primavera for a long time, we may realize the software become slow.

Our database is become bigger and bigger. And the slow performance is may be because of the limitations of SQL Server Express Edition, not because of the CPU or RAM.


1


Based on the table you can see SQL Express only support:

  • 1 CPU
  • 1 GB RAM
  • 10 GB for database size.

No matter how your PC is strong, it only take a few resource from it.

So you may consider buy SQL Standard Edition before upgrade your PC hardware.

Tags:
14
Continue reading
18643 Hits
0 comments

Automatically update progress in Primavera: The difference between Apply Actuals and Update Progress

2
 

In Primavera, when you need to make a quick update of project (Let’s say everything goes as it’s planned) we have 2 ways of automatically update progress:

  • Apply Actuals

Update Progress


1

Here I will only explain what is the difference between these 2 options.

The Apply Actuals function will update any activities with the “Auto Compute Actuals” checkbox marked…

PATTLNK_12212005_160054-cwilkinson-image

…whereas the Update Progress (Progress Spotlight) feature will update activities which fall within the spotlighted region regardless the status of “Auto Compute Actuals” checkbox.

PATTLNK_12212005_155938-cwilkinson-image

And this is the rule when Primavera automatically apply the Actual (in both option):

  • Apply an Actual Start to all Activities that have a Planned Start < Data Date. The Actual Start is set to the Planned Start.
  • Level of Efforts and WBS Summary activites get there dates from other activities.
  • Planned Finish is not changed.
  • Calculates Remaining Duration as the Early Finish-New Data Date.
  • Calculates Actual Duration as Original Duration-Remaining Duration.
  • Calculates Actual Units as Activity % Complete * At Complete Units..
  • If Planned Finish is < Data Date, then an Actual Finish will be applied. The Actual Finish is set to the Planned Finish.
  • Actuals are subtracted from Budgeted values to calculate Remaining values.
Tags:
14
Continue reading
21099 Hits
0 comments

New Approaches to Level Scheduling

 
Some methods suggest using more details, targets and objectives at each level, while others have traditionally not done so in many lower-level schedules. For example, level 2 schedule considerations vary widely, from including subdivided components, details or intents to including little to no higher-level details, summaries or intents.
 
Recent theories take a different approach to traditional level scheduling, especially regarding the details and information included in each level.
 
AACE International’s Recommended Practice No. 37 (RP 37), Chartered Institute of Building (CIOB Guide) and the Guide to the Forensic Scheduling Body of Knowledge Part I (FSBOK Guide) each bring new ideas into the project planning and scheduling field. But the main concept of establishing a common detailed framework for a project is universal.
 
Developing a common work schedule framework from the onset allows for easier level schedule development as a project progresses. Of course, details will continue to be added to each level as activities are confirmed and processes are firmed-up.
 
By using a combination of RP 37 and the CIOB Guide suggestions, you can implement a progressive elaboration approach. This approach is based on the idea that it’s impractical to plan a working schedule (with all of its details) at the onset on a project, since the schedule’s density will increase as more information and details become available and are confirmed.
Additionally, the FSBOK Guide introduces a multi-level schedule hierarchy. This helps ensure logical summary-level and detailed-level scheduling for mega- and major contracts through the creation of a foundation schedule. This five-level approach divides each level’s criteria into two categories: general intent and format, and scheduling objective. With this subdivision of criteria, each level is able to include all of the general details and information about the project and keep the team on the same page.
 
FSBOK’s multi-level hierarchy divides the scheduling into five levels:
  • Level 1: Graphical snapshot of driving summary activities and logic for executive and senior managers.
  • Level 2: Establish the driving critical path and near-critical path to contract, and key milestones for senior managers, including the project manager.
  • Level 3: Detail needed for construction management, staging deliveries and project control for construction manager and scheduling staff.
  • Level 4: Working schedule that supports Level 3 sequences for area supervision.
  • Level 5: Look-ahead schedule for crew foremen and supervision.
Although all of the new approaches agree that a common framework should be developed, they disagree on a method for addressing schedule density or granularity through the progression of the project. CIOB advocates increasing density of downstream activities, whereas FSBOK promotes holding to a uniform schedule granularity. Each approach has its advantages, and one may work better for certain projects and schedules than another, so it’s wise to be flexible and use alternative methods as needed.
 
Regardless of the approach taken, it’s important to keep all levels on the same page, making sure they are connecting with the overall schedule. To that end, the new approaches suggest using a coding structure to ensure horizontal and vertical integration throughout the project.
Approaches to project scheduling and planning continue to evolve and change, and it’s helpful to incorporate new ideas into your planning. But it’s also critical to remember that while each project and project team works differently, it’s vital to keep everyone on the same track through the duration of the project
Continue reading
789 Hits
0 comments

Capital Cost Optimization On Gas Fired Power Projects Through Standardization


In this paper, after going through the benefits of standardization, various technical aspects are discussed, like what all facilities can have standardized design and what all can have site-specific designs depend on contract & site conditions. Planning & monitoring of such multiple projects in one of the project management tool, called Primavera Project Planner (P3), follow this. Savings in cost is explained in the form of case study, which shows how much percentage of cost can be saved, by designing & executing multiple projects simultaneously using standardization technique. Various factors, which can have a adverse impact on standardization, are also discussed in the later part before concluding this paper.

A: Introduction

The cost of power supplied to the end consumer comprises of components like cost of setting up the plant, operational cost, cost of transmission and cost of distribution. If the cost of power supplied to a consumer were to be reduced, the cost associated with each component would need to be reduced. If we focus on set up cost of power projects, it not only involves substantial capital investment but also the gestation period is longer compared to other industries. The project capital cost is one of the important parameter on which the unit cost of power is worked out. For the same reason, emphasis is being given on reduction of this cost and various ways has been suggested from time to time. One of the ways to achieve this is, by designing and executing multiple power projects simultaneously using standardization technique.

The purpose of this paper is to discuss practically all aspects related to standardization of a Gas fired CC based power project, followed by a case study. Though the paper details practically every aspect related with the standardization, focus will be on the capital cost optimisation from the viewpoint of owner, as it is a major factor in deciding the unit cost of power to be supplied to end consumer.

To begin with, author highlights the benefits of standardisation.

B: Benefits of standardisation

B.1 Savings in cost & time:

·         Through bulk procurement of identical equipment & materials, which constitutes the major part of project, owner could negotiate lower supplier pricing for them. Also the home office job-hours required to specify and procure would be extended only on an initial project.

·         The evolutionary design process leads to a family of plants, which can transfer experience from one project to the next. Standardisation, which is inherent in a family of nearly identical plants, plays a significant role in reducing construction and start-up costs and time.

·         Substantial cost and schedule improvements are realised during construction as techniques are passed on, rework is reduced, more efficient methods are developed and familiarity with the design increases. This is evident at multi-unit sites where the subsequent units are completed in shorter times. The benefits of shortened construction schedules on successive units can also be demonstrated on the projects, with a six-month reduction in construction time from the first project to the third project. While influential in reducing construction cost, this shortened schedule also provides a quicker return on investment for the plant owner.

·         The significant cost benefits from series development is the savings in design and engineering job hours/cost by standardising designs of major systems.

B.2 Assured Innovation:

·         Standardisation based on proven technology guarantees a plant performance that leads to a reduced financial risk for the project.

Before proceeding further, it is imperative to understand the basic technical aspects of power projects, which are explained in the next section.


C: Technical aspects of power project:

Here, author has considered Combined cycle (CC) power plant, which consist of mainly a CTG, a HRSG, and a STG. Combined cycle is the technology, which uses the fuel to run the CTG and also uses wasted exhaust heat from gas turbines to produce steam that drives an additional turbine. CTG, HRSG & STG forms one power block/train and as per the power requirement, multiple trains needs to be designed. The condenser and the closed cooling water (CCW) system for each train are cooled by its corresponding circulating water system that rejects heat to the atmosphere via cooling towers. Each train includes a GSU transformer. Two generator breakers are provided for the protection of the CT and ST generators. Power is carried by isolated phase bus duct to the GSU and UAT transformers.

In the next section, author identifies systems/facilities of a CC power plant, which can be standardised. Once the design for that specific system/facility is accomplished for the first project, the team can simply adds the site-specific features to the down-the-line projects to produce a complete plant design.

D: Systems/Facilities under standard plant design

The major process systems, including the power island/block can have a standard design. Apart from power block/island, following equipment/system/facilities can be a part of standard plant design.

·         Totally enclosed water-to-air cooled (TEWAC) generator. The generator can include excitation system, controls, neutral grounding equipment, and other auxiliaries required for a fully operational unit.

·         Surface condenser and vacuum pumps.

·         Single condensate pump.

·         Closed cooling water (CCW) system.

·         DCS equipment and data highway.

·         Variable speed boiler feed pump.

·         Continuous emission monitoring system (CEMS).

·         Fuel gas treatment system (filtration, heating, and scrubbing).

·         HRSG chemical feed systems.

Within the standard power block, space and connections (condensate supply and return, and electrical) can be provided for up to two condensate polisher trailers. Condensate polisher trailers are used to remove impurities from the condensate, which comes from STG.  Additionally all piping and raceway that is part of the standard power block can be standardized in design.

The standard plant layout can include a standard location for the central control room building; the main step up transformers; the ammonia unloading and storage facilities; the auxiliary boiler; the CTG static start systems; the fire water pumphouse; and the space for emergency diesel generator. In addition, the standard plant layout includes a designation of the relative areas for the cooling towers, circulating water pumping facilities and the water treatment facilities. Standard designs can be used for the central control room building; the fire water pumphouse; and to the extent possible, for the cooling towers, major pumps & structures, and main transformer foundation.

In the next section, author identifies those systems, which would support one or more standard power blocks and can be considered as site specific.

E: Systems/Facilities under site specific design

Due to various site-specific criteria’s like site location, site elevation & barometric pressure, temperature conditions, soil properties etc., various facilities need to be designed as per the individual site conditions. Design for following facilities/systems, needs to be site specific.

·         GSU for each power block.

·         Cooling water systems, including cooling towers and circulating water pumps, to provide cooling water to the condensers and CCW system for each power block.

·         Packaged auxiliary boiler with stack.

·         A distributed control system (DCS).

·         Make up water clarification system with recirculating solids contact clarifier, sludge recirculation and discharge pumps, and chemical feed skids.

·         Filtered/fire water storage tank.

·         Sodium hypochlorite injection system for makeup and circulating water microbiological control.

·         Process makeup water treatment consisting of multimedia filters with chemical metering pumps, train demineralizer, regeneration and waste neutralization skid, acid feed system with tank, and caustic system with tank.

·         Demineralized water storage.

·         Sanitary waste collection system, lift stations.

·         Fire protection system.

·         Instrument air compressor and dryers.

·         Yard lighting system.

·         Domestic (potable) water distribution.

·         Heating, ventilating, and air conditioning (HVAC) systems.

·         Wastewater collection, treatment, and discharge system.

·         Ammonia unloading and storage system.

·         Hydrogen distributed system & trailer pads.

·         Electric power distribution system including a common electrical module.

·         Stormwater collection and discharge system.

·         Plant communications wiring and raceway between plant buildings.

·         Switchyard connected to the utility’s substation.

Though some of the above facilities can be standardised to maximise the standardisation benefits, however it depends on various aspects like above discussed site conditions and contract requirement. For the same reason author has preferred to keep them in non-standardised category.

Once it is identified that which all systems are to be standardised and which all will be site specific, the next step is to see how to manage such type of projects in some project management tool, which is explained in next section.

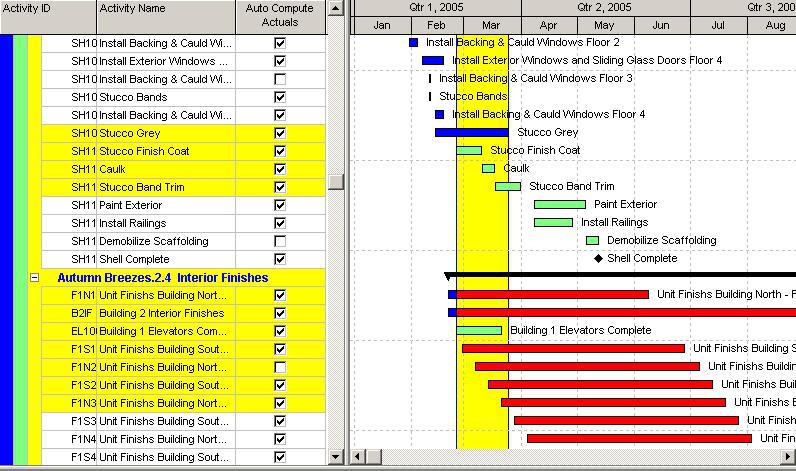
F: Planning/Scheduling aspects

Above discussion might give an impression that 3 project schedules needs to be developed separately, which is an exhaustive process. However that is not the case. One project needs to be developed initially and can be copied to other 2 databases. This will simplify the planning efforts of project management team. Here, author shares his experience of planning and managing such type of projects in one of the project management tool called as Primavera Project Planner (P6). Author has considered 3 CC based projects, which needs to be planned. Two projects are considered to be having 4 power trains and one with 3 power trains.

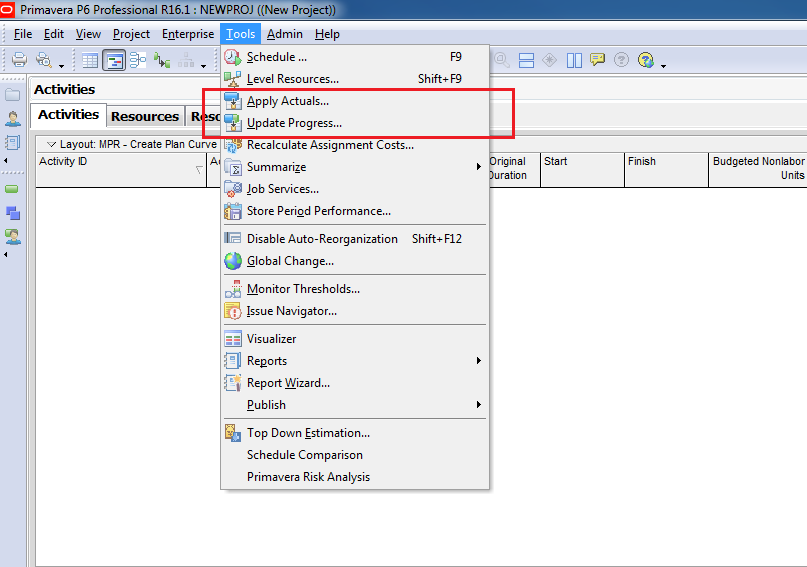
F.1: Development & maintenance of schedule in P6:

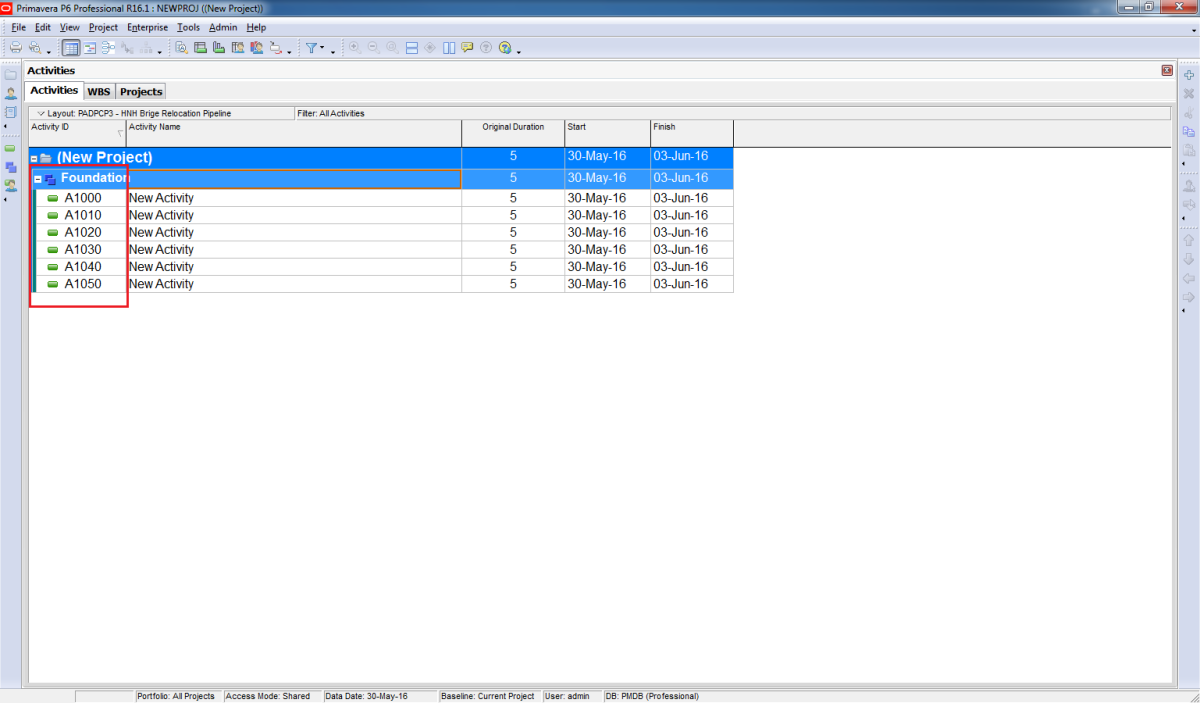
During schedule development stage, say S signifies activities for Standard plant, A for Project A specific, B for Project B specific, and C for Project C specific. S & A are to be clubbed initially and the project plan to be made.

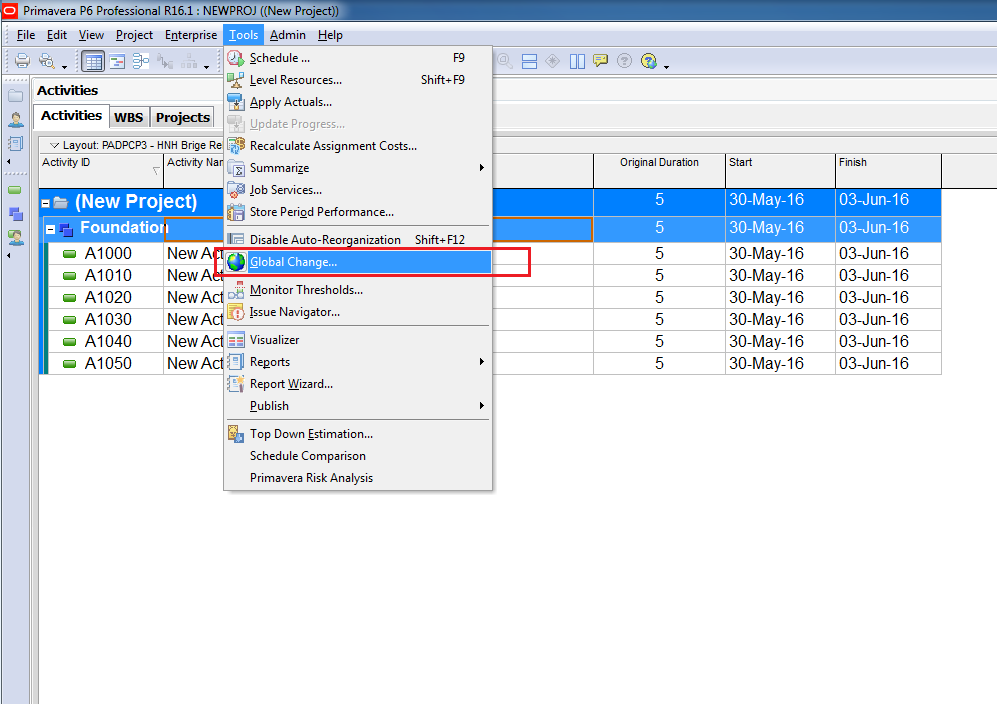
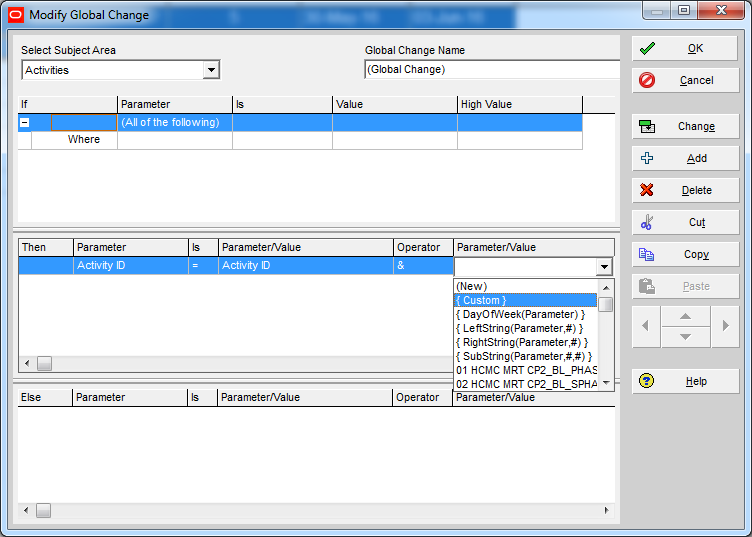
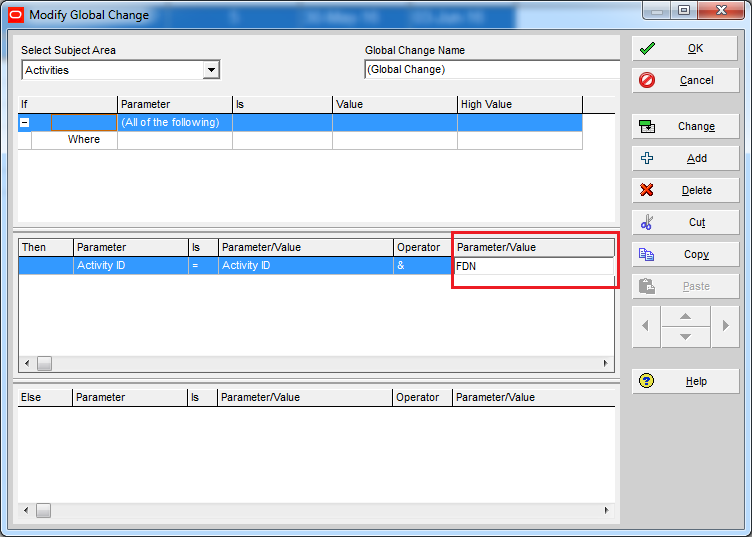
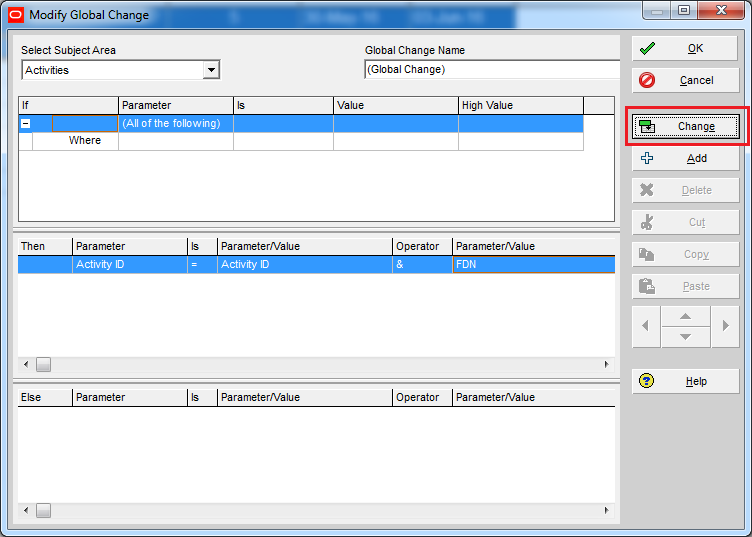
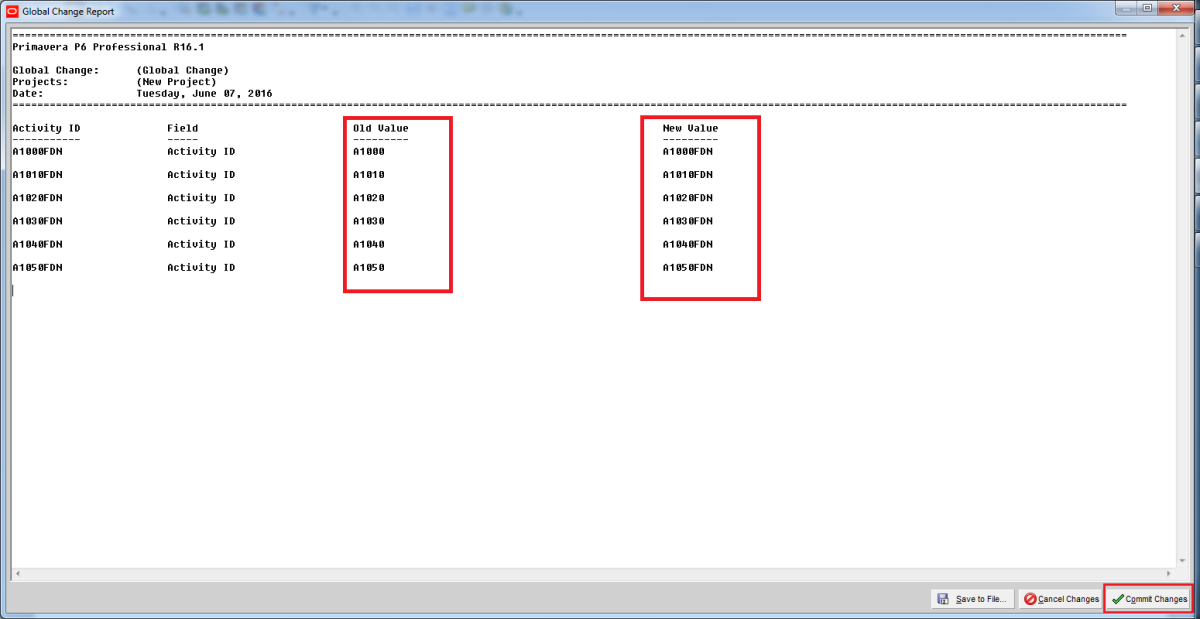
In the beginning, all the “A” project activities will be exactly the same as “B” & “C” project with the exception of the first character in the activity ID “AC” Vs. “BC” for example, one could use the “A” database, global change all the “A” to “B”.  This would cause all the standard activities to connect to “B” instead of “A”.  One can then just copy & paste into the “B” database.

After developing Standard Plant (S), Project A unit #1 & common activities, they need to be copied to Units 2, 3 & 4.  Then A needed to be copied once for B.  Lastly, it need to be copied again, but without unit #4 for C as C has got only 3 trains. It is required to keep all relationships within the units as well as relationships to Standard Plant items and Plant common (non-unit specific) items.  Additionally, it is also required to keep all the resources and constraints on the copied activities. To achieve this, solution is:

·         Create an exact copy of the database (call “HOLD” for discussion purposes). 

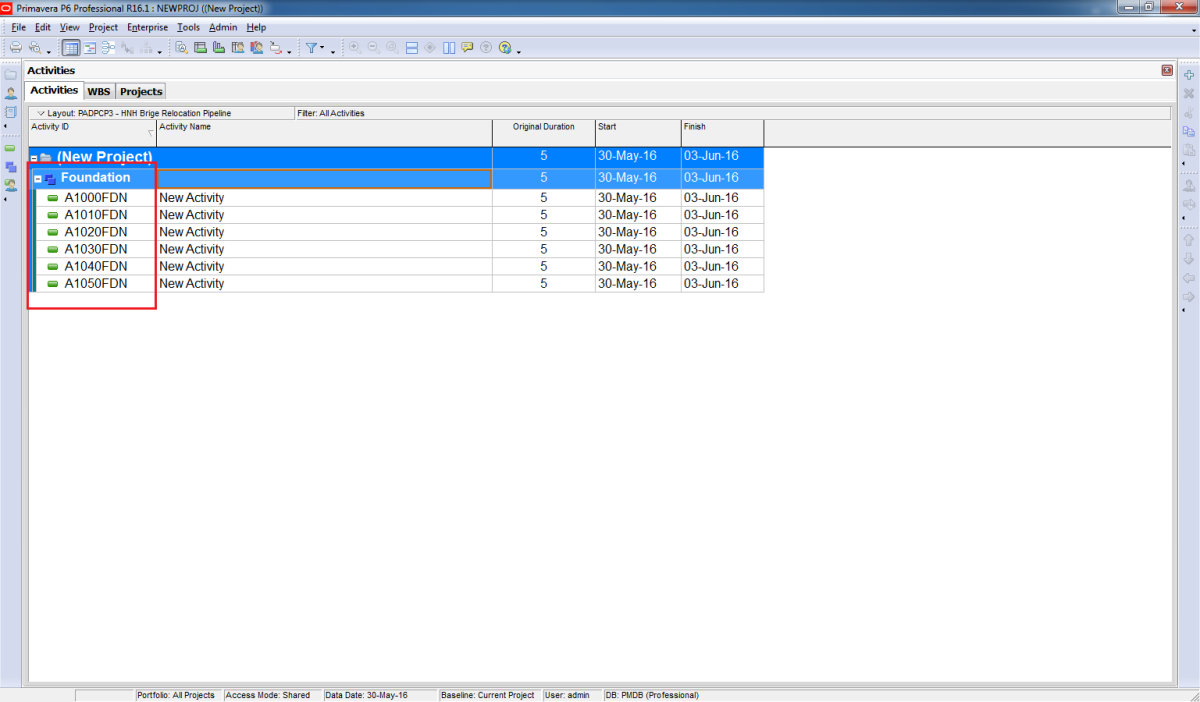
·         To copy units, group both databases by unit and tile them in P3 window. 

·         Run a global change in HOLD to change all Unit #1 activities’ IDs to Unit #2 IDs.  Don’t change the activity code to unit #2 …leave as unit #1 to allow you to continue to select unit #1 for copying Units 3 & 4.

·         Now copy all these items to the active database by clicking under the group heading of Unit#2 and past external links.  This will cause the unit activity code to be updated and b/c the databases are exact copies, the external links to plant common activities will be maintained.

·         Once A is created, delete the HOLD database and recreate using the updated database.  Use the same concept of global changes & paste external links to make Project B & C.

During maintenance stage, once Project A gets updated which includes standard plant, simple copy the standard plant subproject and paste in Project B & C to avoid duplication of updation of standard plant activities in B & C. Only Project B & C specific activities needs to be updated in these projects.

The benefits in terms of cost are explained in the form of case study in next section.

G: Case Study

The subject of discussion is cost savings made from setting up of 3 Gas based Combined Cycle Power Projects in United States of America. The Owner has decided to set-up 3 power projects (Capacity: Project A=1200MW, Project B=1200MW, & Project C=900MW) simultaneously and called for bids. While calling for bids, following conditions related to standardization were given to bidders:

·         Designs for systems/facilities discussed in section D are to be standardized and only replication efforts are to be considered for other 2 projects with minor changes as per the given site conditions.

·         Systems/facilities under section E are to be designed separately for all projects.

·         Bidders were asked to consider a bulk procurement of all major equipment’s and other purchase on project.

On receipt of bids, owner analyzed substantial savings in set-up cost, which ranges from 16%-19%. The analysis was done on the basis of following information provided by the bidder who finally got the contract.

G.1: Design & Other Home Office support job hours & cost:

On an average 300,000 hours are required to design one power project, which includes the required support from various other disciplines. To design 3 projects (A, B, C) simultaneously, bidder considered that project A would consist of standard design & would require approx. 310,000 hours. The extra efforts of 10,000 hours were considered for developing a replication/cloning system for other projects. Since all the major facilities were standardised & replicated for project B & C, bidder quoted only 180,000 hours each to design project B & C. Going by this calculation, owner analysed the savings of approximately (-10,000+120,000+120,000 = 230,000) hours, which leads to 25% cost savings in job-hours. Comparing against overall project cost, the savings from design engineering were 3% (as engineering constitutes 6%-8% of total project cost).

G.2: Procurement cost:

Here owner noticed that procurement of major equipment’s like Gas Turbines, Heat Recovery Steam Generators, Cooling Towers etc. lead to tremendous savings due to discounts offered by vendors for bulk purchase. Also option of placing a combined order for various bulks like steel, concrete, pipes, cables, conduits and other instrument items resulted in potential cost savings. Here, owner noticed the savings of approx. 20%-25% in bulk procurement cost. As procurement consist of 55%-60% of total project cost, the savings from equipment cost came to 12%-15% on total project.

Total savings from job-hours and procurement showed approx. 16%-19% on total project. From Owners experience, for the above configuration power projects, unit rate for such projects comes to $500-550/KW. By designing and executing multiple (in this case 3) projects simultaneously, owner reduced it to $430/KW (18% savings considered).

G.3: Summary table of savings:

The summary of savings experienced under section G.1 & G.2 are listed below:

Cost Heads

Cost Proportion (approx.)

Savings

(approx.)

Engineering

7%

3%

Power Island equipment

60%

12%

Other purchase

10%

3%

Construction

15%

Indirect savings*

Start up

8%

Indirect savings*


Total Savings: 18% (approx.) + Indirect savings*

* Indirect savings are explained in section I.

Though author has experienced cost and other benefits while going for standardization, various aspects, which can have adverse impact, cannot be neglected and are explained in the next section.

H: Drawbacks

The drawbacks of standardisation of designs are listed here below:

·         Very high capital investment is required to execute multiple projects simultaneously.

·         Various permits from different governing & regulatory bodies are required due to different geographical locations and may affect standardisation. Also the feasibility of supply of same fuel to all these plant is major concern, which needs to be checked before going for standardisation.

·         Site conditions of different locations for e.g., source of water availability, quality of water available, soil condition etc. may have an impact on standardisation.

I: Conclusion:

By setting up multiple power projects simultaneously, the owner can save almost 15% -18% of total capital cost through standardization, undoubtedly a powerful cost saving technique, but requires large capital investment. This capital investment in power sector in any country will attract taxes and duties concessions from the local government, further improving saving in capital cost. Also, by designing multiple projects with one team, organizations can maximize their lump-sum turnkey resources. In the field, construction and start-up best practices & lessons learnt from one project can be directly applied to other sites, which leads to indirect savings. Standardization would help the organizations to successfully implement its strategy to develop large projects while reducing execution costs and providing faster speed to market and greater certainty of outcome. With this standard plant technique, owner is bound to gain an important position and a competitive edge in EPC market.

Acronyms used in the paper:

HRSG             :           Heat Recovery Steam Generator

CTG                :           Combustion Turbine Generator
STG                 :           Steam Turbine Generator

GSU                :           Generator Step-up Transformer

CCW               :           Closed Cooling Water

UAT                :           Unit Auxiliary Transformer

LCI                 :           Load Commutated Inverters

CT                   :           Combustion Turbine  

ST                    :           Steam Turbine

DCS                :           Distributed Control System

BOP                :           Balance Of Plant

TEWAC          :           Totally Enclosed Water to Air Cooled

CO                  :           Carbon Mono Oxide

HVAC            :           Heating, Ventilating and Air Conditioning

LAN                :           Local Area Network

CC                   :           Combined Cycle

EPC                 :           Engineering, Procurement and Construction

KW                 :           Kilo Watt (Unit of measurement of power of Energy)

MW                 :           Mega Watt (Unit of measurement of power of Energy)

ID                    :           Identification number

P3                    :           Primavera Project Planner (Project Management Software)

BIBLIOGRAPHY


¯  Unpublished company handouts from Project Controls University Classes.

¯  Skills & Knowledge of Cost Engineering – 4th Edition by Dr. Richard E. Larew

Tags:
24
Continue reading
4173 Hits
0 comments

Graphing a P6 Resource S-Curve in Excel

Tutorial Files


Step 1 – Export Primavera P6 Resource Assignments to Excel

image001

Following the steps from our previous tutorial, you now have all the resources and assignments in an Excel sheet. You can modify the primary sheet for better graphical features.

Step 2 – How to Use the Data

image002

To draw resource curves, what we need is the two highlighted rows which are the cumulative total and the incremental total. They have the information needed for each month. So we just copy and paste these two rows and the date row to another sheet to have more space doing our job.

Step 3 – Copy and paste the needed data in separate sheet

image003

Copy the data to separate worksheet. Now we have all the tools to paint a perfect picture of our project resources. All we need is to use some formula to calculate the percentage progress for each month in our table.

Step 4 – Calculate the Progress Percentage

image004

To calculate interval progress and cumulative progress, just divide the value for each month (man hour needed for each month) by the total value (the summation of all man hours).  You can see the formula in the Excel file attached to this tutorial.

Step 5 – Graphing the S-Curves

image005

To graph any curve we should go to Insert Section of Excel and then choose a chart type in charts tab. For this tutorial purpose we’ll select the Line chart.

Step 6 – Defining the S-Curve’s Resources

image006

Right-click on the curves that Excel generated by default, which is not the curve that we want, and choose “Select Data”.

image007

Remove all the predefined sources and then hit the “Add” button.

image008

In this box define all the sources one by one. We should do it 3 times to define all the sources for our final S-curve. I define all the series below:

Series Name Series Values Formula
Monthly Man Hour The row that shows interval man hour for each month =Sheet5!$C$3:$X$3
Cumulative Progress The row that shows cum. % prog =Sheet5!$C$4:$X$4

image009

The last source definition is for the dates which result in our X axis. To do that on the “select source data” box and under the “Horizontal Axis label”, hit the edit button and you will see a similar dialogue box as the above dialogue boxes:

image010
image011

Select all the dates as the label range for the horizontal axis and hit “OK” on dialogue box and then on the “select Data Source” box. Now you have the following chart

image012

Now we should modify this s-curve, so we go step by step:

Step 7 – Select a Primary and Secondary S-Curve

Right-click on the curves and select “Format Data Series”. In the” format Data series” box select the “Cum Progress” as the secondary curve (it means that this s-curve values are shown on the right hand axis)

image013

image014

Step 8 – Change the data type to a “2-D Column” chart

Right-click on the monthly interval man hour curve (ie:the blue curve) and then select the “change series chart type”. In the “change series chart type” box, select “2-D Column” chart.

image015

Step 9 – Adjust the Right-hand Vertical Axis

Right-click on the right-hand vertical axis and select “Format Axis” in the dialogue box go to Axis options and change the second value from the top of form to 1.00.

image018

image017

Now you have a resource S-curve which still needs some modification:

image019

Step 10 – The Final Touches

In Excel 2007, when you select a chart, a “chart tool” tab will appear on the top right hand side of toolbar. In that chart you can change the color of curves, add title to curve, add table to curve. The following curve which is the final curve is the result of doing some exercises with those features:

image020

Wrap Up

With this new P6 Resource S-curve, now your project manager can easily tell you there is something wrong with resource assignment and some leveling should be done on resources to achieve a better distributed resource S-curve.

There are different ways of developing S-curves in Excel but this method works well in many project circumstances.

Source : https://www.planacademy.com/p6-resource-s-curve-excel/

Tags:
14
Continue reading
20166 Hits
0 comments

How to Download Primavera P6 Professional


Select “Sign In”. Enter your username and password

In Search by box, type “primavera professional”. An suggestion dialog appear, select “Primavera P6 Professional Project Management 16.1”

Select the Platform of your computer

Click Continue

Click Continue again

Check “I have reviewed…” and click Continue.

Click on the first file to download it. You only need this one to install Primavera P6.

After you click your browser will start to download the file.

Done. Check your Download folder to get the file.

Tags:
14
Continue reading
23394 Hits
0 comments

Convert Microsoft Project MPP to MPX to import to Primavera

Convert Microsoft Project MPP to MPX to import to Primavera


Nowadays, Microsoft Project save file as MPP format. However Primavera allow to import file as MPX format.

So, here is the tool help you to convert MPP to MPX.

https://drive.google.com/file/d/0ByHnieTJNwKGdGVybE5LaElOcnM/view?usp=sharing

Tags:
14
Continue reading
26193 Hits
0 comments

How to backup and restore Primavera P6 SQL database


2

Select the database, right-click, go to Task -> Back Up

3

Click on “Add” button

4

Select the backup file destination

5

Enter backup file name

6

Click OK to start the backup

7

Then we’ve got the backup file in our hard-drive

How to restore database:

Right click on Database and select Restore database

9

Select database to overwrite or enter a new name to create a new database from the backup file.

10

Select “From device” and choose backup file

11

12

Change Files of type to “All files” then you can see your backup file. Select the backup file

13

Check on “Restore”

14

Go to “Option”. Check on “Overwrite the existing database”

15

Click OK. And database will be restored.

Continue reading
1106 Hits
0 comments

Where the Engineering work sequence does not match that of construction….


For that reason, Civil Works Installation drawings (page 88), complete with all underground objects and networks, are required very early, for construction reasons, as completion of civil works is a pre-requisite for mechanical works to proceed.

The irony is that these drawings come last in the Engineering work sequence. Take the example of the drains. This is the last network Process engineer will care about… It will nevertheless be a show stopper for the installation of process lines, which will have been designed much earlier.

Tags:
21
Continue reading
19235 Hits
0 comments

What is Project Plan


-In the design method of the project plan, there is always a leader who will initially govern the work that will be enforced throughout the process. There are different means of establishing a project plan. Whether one desires to use software that has been pre-planned or a course of action that calls for self-designation origin, all have certain commonalities that might include:

-Measurable Goal Setting. There must an idea as to where the project is going and in a given time frame what is to be accomplished. The goals must be obtainable and able to gauge. A given time frame must be set to complete a specific sector of the project assigned to certain individuals and that responsibility must be monitored, measured, and a record kept of events by an appointee. This is especially important in situations where each portion of the project relies on completion of another.

-Identifying deliverables. Deliverables can be defined as changes that were made or something new that has been added to accomplish the goals. At any rate, the deliverable should be identified, stating what different steps were used, apart from the original, to meet the achieved goals. Make sure that deliverables are given to an authorized individual and approved. 

-Schedule Planning. Deciding how to use the timeframe that has been given to complete a project to meet the specified goal is important. This route will help one to understand what can be reasonably accomplished, use time wisely, provide extra time for the uncertainties, and to lessen overextension of oneself.
 

-Support plans. These plans include the process that will be used to accomplish the goals of the project. What approach will be used?What are the requirements for reaching the goals of the project? 

Back up plans. For every project that is planned there has to be some type of back up plan. If any part of the original procedures fail or has to be completely changed, there should be another avenue available to take its place. This will lessen the amount of set backs, reassuring that the time allocation that has been set for the project to be finished is met. 
 

Benefits of Project Planning
-Timely completion of project. Time is of the essence and with project planning one can be assured that the project will be completed on target.
-Uninterrupted work flow. In addition, project planning will lessen the disruption of work and allow for continuous progression without a lot of delays.
-Cost Control. The expenditure for the project will be decreased because the monies have been previously allocated and planned to the last penny as to what will be spent on what and when.
-Decreased changes. A work in progress is unsuccessful if there are many changes that have to be carried out and reworked. Project planning reduces these occurrences to the minimal.
-Keeps management informed. Project planning keeps management informed with timely reports as to the status of the project. No one has to guess or wonder what is actually going on, but information will be provided through memos, emails, etc.
-Stability. There is strength among the assigned workers when there is a project paln. Each individual has a clear understanding of what he or she is responsible for and when it is due. Project planning assures that the participants are running the project, instead of the project running them.

Tags:
22
Continue reading
22952 Hits
0 comments

A few things Engineering must do to enable the fast track execution of projects


- a good system in place for design changes. First, develop a strong resistance to design change and habit to strive to find alternatives. For changes that cannot be avoided, early implementation by means of identification of all impacts, prompt actions (E, P, C) and precise dedicated follow-up of implementation of all actions,

- focus and control of key vendor drawings (interface dwgs: GA, foundation and loads, piping connection, load list, PID, control narrative, C&E), avoiding engineering hold up due to vendor information,

- proper organisation for spooling, reducing the lag between design and shop ISOs, such organisation integrates both engineering and the construction contractor,

- definition of relevant early work packages, with construction, during construct-ability workshop,

- maintain up-to date bill of quantities, e.g., list of steel structures to be erected, with dwgs and material delivery dates, for Site to plan adequate resources,

- provide Site with adequate and updated list of items, material take-of, item count etc. to enable an accurate monitoring of the construction progress. The Construction progress shall indeed be measured against the up-dated work volumes. The later, which constitutes the "100%" will keep changing up to the end of Engineering. It is necessary that such changes are incorporated in the Construction progress measure in order to reflect the progress against the actual work volume,

- Implement a precise Engineering progress monitoring. Such as precise progress monitoring is one where steps are precisely and indisputably identified, such as with a binary status 0/1 (document not issued/document issued). Intermediate statuses, such as "document started" etc. shall not not considered. The individual document status is weighted by the number of documents to give the progress of a task consisting of the issue of multiple documents, such as P&IDs.

Tags:
21
Continue reading
19329 Hits
0 comments

Schedule updating

 
Schedule up-dating
The completion date is extended by the impact of the event, as demonstrated by the schedule logic, on the completion date.
There will therefore be an extension of the completion date only if the event affects the critical path of the schedule network, i.e., a chain of activities with no float.
 
The calculation of an extension of time is therefore totally dependent on the integrity of the schedule network.
Let’s focus on what comes into this integrity:
 
- firstly, the integrity of the initial schedule, submitted for the Owner’s review and, once approved, becoming the baseline,
 
- secondly, the integrity of each schedule up-dates
 
The object of the present post is to give insights into the second bullet point: schedule up-dates.
 
The contract requires the contractor to update the project schedule periodically (usually the contractually specified period is a 30 calendar days period) and evidence whether the project completion date or contractual milestones are met or delayed.
 
At the end of any period, the up-date of the schedule consists of entering:
 
• The actual staring date of the activities that have actually started during the period
 
• The actual completion date of the activities that have been completed during the period
 
• The remaining durations of each activity that is in progress.
 
• Any event that has occurred in the period between the 2 cut-off dates, typically month N and month N+1, and has caused delay or a modification to the schedule network.
 
• The modifications to the activity network resulting from the better knowledge gained in the period about the project, such as more precise estimate of quantities, work volumes, sequence etc. allowing to refine the coming plan
 
 
(more details about how the scheduler actually proceeds are given at the bottom of this text)
 
 
Hence the up-date consists of both:
 
• adjusting the time schedule according to past performance
 
and
 
• refining the time schedule of the future activities.
 
When updating the schedule (the 5 steps above), the scheduler uses and relies on a variety of information, including:
 
- reports of actual work done, such as documents issued, purchase order placed etc.
 
- minutes of meeting, allowing to identify hold-up’s and make sure they are reflected,
 
- trend register, allowing to identify hold-up’s, in particular from Client, and make sure they are reflected
 
Once the 5 above steps are done, the scheduler will re-schedule the Project, by making a forward pass, which will give the latest forecasted dates of future activities and the Project Completion Date (CD).
 
This forecast, in particular that of the CD, is an estimate that will change at the next schedule up-date. Actions do NOT need to be taken at each schedule up-date should the CD slip beyond the required one.
 
Indeed, the CD might revert to the original one at the next up-date should, for instance, the lead time of an equipment prove shorter than expected etc.
 
Should the CD remain consistently delayed over few schedule up-dates (says 3 successive periods), the Planner will then consider a 6th step in the schedule up-date: re-planning.
 
 
• This will consist of reviewing the critical paths, the sequence and duration of their activities and identifying what changes to the execution, such as doing some activities in parallel, increasing resources to reduce a task duration, changing the work sequence or method etc. are required to revert back to the original CD.
 
 
From a contractual and commercial perspective, the up-date of the level 3 schedule is highly critical as the level 3 is the only tool that fully identifies and supports the existence of a causal link between the event and its consequence that is: a delay of activities of the critical path.
 
Only with such support Contractor can firmly establish its entitlement to an Extension Of Time (EOT) and identify the liable party.
If a CPY event impacts the critical path, this exercise will permit to quantify the extent of this EOT and, as a consequence, the cost that contractor may claim (time related costs).
 
The critical paths will become more precisely defined, and will change during the project execution.
 
As impact to the critical path forms the basis for the calculation of an EOT, it is essential that schedule up-dates properly reflect the current and critical paths(s).
 
This means that the level 3 schedule must be based on the up-to-date execution plan of the CTR, in order to allow assessing the true impact of any event.
 
Additionally, it is essential that all delays of CPY origin are reflected in the schedule up-date as the CTR’s obligation under the contract is to up-date the level 3 on a regular basis with all impacts.
 
Overlooking one delay event would forfeit CTR’s right to an EOT.


Annex:
 
DETAILS OF LEVEL 3 SCHEDULE UP-DATING OPERATION BY THE PLANNER:


STEP 1: REFLECT PROGRESS OF WORK DONE IN THE PERIOD
 
 
0) Do nothing for finished activities.
 
1) Activity that was already started in the previous schedule up-date and that was forecasted to finish in the reported period:
 
• If the activity has actually finished, put the AF date.
 
• If the activity has not finished. Its finished date should be re-forecast. This can be done in 2 ways: either by asking the discipline concerned an estimate of when it will be completed, and entering a corresponding “remaining duration” in the scheduling software, or by entering a percent progress and letting the software calculating the finished date. Contractors usually use the first method as it offers more “flexibility”.
 
Let’s consider the two methods:
 
Say an activity has an original duration of 20 days and started 10 days ago. Say the progress is 50% at the cut-off. When asked, the concerned discipline states that the activity will only be completed in 20 days. Using the first method allows to set the finished date as per the estimate of the discipline by entering a remaining duration of 20 days. Thus from an initial duration of 20 days, the updated duration shall be 30 days.
 
Using the first method and entering the 50% percent progress figure would have the scheduling software calculate a remaining duration of 10 days (as 50% progress in 10 days leads to 100% of the activity to be completed in 20 days).
One sees that, due to the non linear progress of most activities, in particular Engineering activities, the first method is more suitable than the second.
 
2) Activity that was already started in the last schedule up-date and that was NOT forecast to finish in the reported period:
 
The planner might change the remaining duration, if required, upon advice from discipline about estimated remaining duration.
 
3) Activity that was forecasted to start in the reported period:
 
• If the activity has actually started, enter the AS and up-date, if required, the remaining duration
 
• If the activity has not started in the reported period, put a forecast start as a fixed date (constraint), as advised by the concerned discipline. (note: this constraint overrules the logic). Modify the original duration if required.
 
Note: do not extend the lag with the predecessor as this is not logical: the reason for the delay is not a lag between the 2 activities.
 
4) Activity that was neither forecast to start nor to finish in the reported period:
 
As this activity is linked to predecessors, it might shift automatically through the schedule logic as a result of the shift of its successor(s) due to start or finish in the reported periods and up-dated in steps 1 and 2.
 
Additionally, the planner might change the remaining duration, if required. This will happen, for instance, if the amount of work anticipated for the activity has a result of the project progressing, better definition etc
 
STEP 2: CORRECT THE NETWORK WITH LATEST AVAILABLE INFORMATION ABOUT THE PROJECT
 
Refine the schedule logic and task duration with the more precise information now available, e.g. equipment lead time, amount of work for activities etc.
 
This will also entail addition and deletion of activities. A schedule density indeed increases when time is closing in: its density will be high for the next three month, medium between 3 and 6 months and low beyond 6 months.
 
For instance, as soon as more information among a category of equipment will be known, one of them will need to be singled out as a long lead time, or requiring more time for assembly etc. E, P and C activities for this equipment will be separated form that of its equipment group by creating new activities.
 
Re-schedule and look at the impact on the CD.
 
Looking at the critical paths, correct some obvious mistakes to avoid unrealistic impact on the CD.
 
Do not go beyond this type of corrections. In particular, do not change the sequence or activity duration unless to reflect the true anticipated execution and latest information.
 
This gives the trend or forecast, reflecting the true estimated completion date on the basis of the actual progress and latest information to date.
 
Up to this point what the scheduler did is to reflect the true status of the project and to derive the trend, i.e. forecast completion date, nothing more.
 
This is similar to what the cost engineer would do while identifying the “to go”, i.e. what remains to be spent.
 
STEP 3 (NOT SYSTEMATIC): RE-PLAN, IF REQUIRED, TO REVERT TO THE ORIGINAL CD
 
This step, which takes time and requires reset of commitments from various parties, does not need to take place at each schedule up-date every month.
 
Additionally, from one month to the other, it may very well be that the anticipated delay to the CD will be resolved.
When review and re-planning is required to revert to the original CD, the following shall be done:
 
Review the different Critical Paths:
 
• Revisit each critical path, check that the sequence is correct, e.g. no spurious logic links, adjust the sequence as required, adjust activity durations based on latest information, such as equipment lead time, work volumes, latest information related to construction sequence etc.
 
• If the previous step is not enough to revert to the original CD, identify some change of logic, such as carrying out activities in parallel etc, or reduction in duration, that would allow to revert to the original CD. Discuss the same with the concerned parties: Engineering, Procurement and Construction managers and get their buy in. It is very important at this stage to get such commitments.
 
• Finally, describe and explain the basis all the above changes in the schedule up-date narrative, in order:

  • 

To build everyone, in particular the Client’s, confidence that these changes of logic/duration are sound,


  • 

To ensure the changes are fully evidence to everyone, so that each one takes the proper actions that concerns her/him
Tags:
22
Continue reading
25104 Hits
0 comments

Categories

Search

Australian Open Learning Pty Ltd t/a Project Controls Institute, Australia | RTO CODE :45806