This paper attempts to identify the causes of delay on a construction project. The concept of schedule controls is discussed with a focus on the critical path method of network analysis technique. Various types of delays are detailed for compensation applicable against each of them, with a focus on documentation required in support of the delay analysis.
Various approaches for delay analysis are discussed further, followed by a case study. The case study represents a schedule delay analysis using the Window Analysis method, which was encountered by the author on a construction project. This case study highlights the underlying concepts of schedule delay analysis and visual effectiveness of the window analysis method.
IMPORTANCE OF SCHEDULE DELAY ANALYSIS ON
CONSTRUCTION PROJECTS – A CONTRACTOR’S PERSPECTIVE
1. INTRODUCTION
Construction industry has been a busy industry in the 20th century. Vast multitudes of projects have sprung up, especially since the Second World War. With the growth rate going up constantly, a fierce competition has been set up among the builders. A construction project is typically a series of activities that have a specific objective to be completed within certain specifications and the start/ end dates are well defined. The construction projects are usually capital intensive with a lot of debt and interest components and everybody wants to earn profit on the investment, as soon as possible. This has prompted the surge of fast track projects worldwide.
Construction project schedules are typically a compressed one on fast track projects. To keep up with the competitive pressures, it becomes quite essential for companies to control projects, using all tools for tracking and monitoring. In addition with low profit margins and involvement of many parties at a time, these projects have inherent risk of schedule slippages and subsequent monetary losses. Therefore it is very important that the potential delays are looked into well ahead of time and mitigated implementing suitable workarounds. Even then the schedule may slip and it is of utmost importance to keep a tab on delays arising out of various reasons, especially those from the other parties i. e. the owner, fellow contractor or the subcontractor, right from the design phase through the commissioning of the project. The documents form the basis for delay claim analysis at a later date so as to save one party from the losses made on account of the failure of the other.
The purpose of this paper is to discuss practically all aspects related to delay analysis on a construction project, followed by a case study. Though the paper details practically every aspect related with the delay analysis, focus will be on the Lump Sum Contract from the viewpoint of a contractor, as it carries the maximum risk for a contractor.
As it is the contract document which details the policies in case of delay claims, the following section will discuss various types of contracts and factors for deciding the type of contract before formally accepting it.
2. CONTRACT TYPES AND DELAY IMPACTS
A Contract is a legal agreement between the owner and the contractor for successful completion of the project and it details comprehensive guidelines including that for delay and disruption of work for various reasons. The Owner specifies and pays for the work whereas the Contractor executes the job for getting profits. The parties involved should Read The Full Contract before formally entering it.
Various types of contracts are prevalent in the construction industry depending on the priorities of the owner and mutual agreement between the owner and the contractor. The most popular types of contract being used in construction industry are detailed below:
2.1 Lump Sum/ Fixed Price Contract
In Lump Sum Contract, the contractor agrees to perform the specified work for a fixed price. If the owner needs some extra work to be done, a variation in contract is to be finalized with mutual agreement, which may affect either schedule or cost or both. It is the sole responsibility of the contractor to complete the job and remain on budget. The price has to be the minimum possible to remain competitive while bidding as well as it should not be impractical to run into losses. Since the optimum balance is sought while bidding the amount, this type of contract is normally used where traditional method of construction is being used and there are minimum chances of significant deviations. In this contract, the contractor owns total risk but has the maximum incentive also for early completion. For owner, the advantage is competitive bidding.
It is very important for the contractor to continuously monitor schedule & cost progressively and keep the budget on track. Delays can eat away the profit margin of the contractor and/ or cause slapping of liquidated damages from the owner, per conditions of the contract.
2.2 Cost Plus Fee Contract
The Cost Plus Fee Contract normally provide for the contractor to do the work, get reimbursed for the material & labor cost of the job and a fee for profit on top of the reimbursement. This fee is usually a percentage of the final cost of the project or a fixed fee. This method provides little risk for the contractor but small profit as well. Here the owner takes the maximum risk and is exposed to the cost overruns due to poor performance of the contractor. This contract is used where time and quality are of prime importance. A variation to this contract is Guaranteed Maximum Contract where the maximum amount is capped, if the contractor delays inordinately and cost overruns are too high.
2.3 Unit Price Contract
The Unit Price Contract allows the contractor to get estimated quantities of defined items of work and in turn get paid for each unit executed. Total payment is based on the units of work actually done and measured in the field. This type of contract is normally used for relatively small scope of jobs and when definitive estimates can be prepared to calculate the quantities for a fair degree of accuracy. In this contract the risk is equally shared between the owner and the contractor.
In brief, the following factors mostly affect the types of contract to be executed:
¯Extent of the work scope definition
¯Accommodation of fast tracking to complete the job
¯Allocation of risk level between the owner and contractor
¯Expertise of the contractor/ owner in the subject field
¯General market conditions
It is clear that the allocation of risk level is an important factor for finalizing the type of the contract executed. As detailed above, schedule slippage risk is an underlying factor for practically all construction contracts. Therefore it becomes imperative now to discuss fundamentals of schedule control, which helps track the progress on projects and take corrective actions from time to time.
3. FUNDAMENTALS OF SCHEDULE CONTROL
Delays can impact a project in numerous ways. The one impact is common that they all cost money. Field and home office overhead costs get escalated. Work that could have been performed in good weather gets pushed out into bad weather. Continuous hindrances on a task can greatly reduce labor productivity and lower morale of the workers. Material and labor cost could escalate due to substantial delays.
Various Hierarchical Schedules are developed on a project to monitor and control effectively and avoid delays. The hierarchy defines the schedule control system and is shown in Figure 3.1 on the following page. The different level schedules are detailed below, which are typically used for construction projects:
¯ Level I: This is Contract Milestone Summary Schedule. Usually one page shows overview. This is used mostly at the Director level of the companies to review the project.
¯ Level II: This is summary level schedule from Level III schedule detailed below. Senior management at jobsite as well as at home office uses this schedule to review the project.
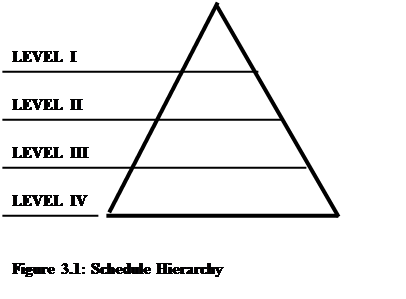
¯ Level III: Level III schedule is usually the controlling engine for all the schedules. This is an Integrated Schedule for all the functions and used by department managers
for review.
¯ Level IV: Level IV schedule is detailed work plan and lower level of details compared to Level III schedule. This is typically used for regular progress review at site and is field superintendent level schedule. This basic schedule supports all upper level schedules. The project is controlled using this schedule and is used for delay analyzes as well.
Among the various methods that are available, the Critical Path Method (CPM) is the most popular schedule analysis method, used for tracking the progress of construction projects. Figure 3.2 on the following page depicts a simple CPM network using Arrow Diagram Method. Project activities are shown by arrows in the arrow diagram method, with a Node or Event at each end. Activities take time and resources to be carried out and serve as the building blocks of the network.
Activities are logically interrelated in the network and each one of them is assigned a reasonable duration. The durations must be estimated with reasonable certainty for this method to be successful. For an activity to commence, all immediate preceding activities must be completed. If an activity starts before its preceding activities are completed, the activity must be subdivided to honor the logic of the network.
Dummy activities are used only to show relationships between activities and have no time duration. They are used as restraints for the succeeding activities to start.
The network in Figure 3.2 shows sequence of activities for erection of an equipment. Activity Erection can not start till base plate is installed on the foundation, equipment is
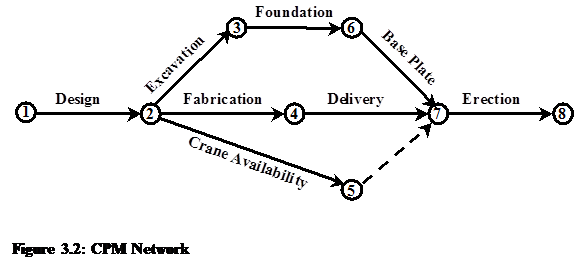
delivered and the crane is arrived on the jobsite. Dotted line represents a dummy activity. It is a restraint for the activity of erection to start.
After creation of a network and assigning duration to each of the activities, start/ finish time is calculated for individual activity as well as for the whole project. Four limiting times are calculated for each activity on the project, as mentioned below:
¯ Early Start: This is the earliest possible date when an activity can start, allowing for
the duration required for the preceding activities to be completed.
¯ Early Finish: This is the earliest possible date on which an activity can be completed.
¯ Late Start: Latest possible date, on which an activity can start without delaying the
completion of the project.
¯ Late Finish: Latest possible date on which the activity can finish without delaying
the completion of the project.
Calculating the dates is a simple method of addition and subtraction, as follows:
¯ Forward Pass: This is the first step in a network to calculate early start & early
finish dates for each activity. At first, the early start is assigned to the first activity.
Early finish is equal to the early start of the activity plus its duration. It is assumed
that the activities start as soon as the immediate preceding activities get finished.
Hence for other activities, early start is equal to the largest of the early finish times of
the immediate preceding activities. This forward calculation process continues till
last activity of the project is reached, which gives early dates for the individual
activities and the early finish date for the total project as well.
¯ Backward Pass: This is the second step in a network to calculate late start & late
finish dates. Here a finish date, either the early finish calculated by forward pass or an
imposed one, is set equal to late finish date for the last activity in the network. Then
late start for the activity is equal to late finish minus its duration. Further, Late finish
of an activity is the smallest of the late start times of the succeeding activities. It is
assumed that an activity finishes as soon as its all immediate successor relations are
satisfied. This backward calculation process continues till the first activity of the
schedule is reached to calculate late dates for all activities.
The difference between the Late Finish and the Early Finish or the Late Start and the
Early Start is called as Total Float. Usually Total Float is termed as Float. The activities with the least amount of float are considered as Critical. Ideally any delay to these activities will delay the completion of the project, if no efforts are taken to recover the delay. The Critical Path is defined as the longest path, timewise, of the interrelated activities throughout the project. Since this chain of activities takes the longest time to complete, it is critical to completion of the project. For example, if one of the activities on critical path is delayed by two days and no corrective actions applied to the schedule or the critical activity, the project completion date will be delayed by those two days. Delay involving activities not on critical path generally has no impact on the eventual completion date of the project unless they become critical due to the delay. However, they may impact resource allocation/ availability. The schedule can be loaded with resources/ costs to perform these analyzes.
Free Float is defined as the amount of time an activity can be delayed without delaying the early start of any succeeding activity. This amount of time may be utilized for the activity to delay without affecting the project completion. After that the activity may become critical, subject to criticality of the immediate succeeding activities.
The schedule is updated regularly for the progress at the jobsite and is revised for any major changes in the construction sequence. It is of paramount importance to keep schedules updated regularly and analyze critical paths on a frequent basis. For large projects it is usually beneficial to analyze loss of total float every month. This gives early warning signs to the troubled activity paths and arms the project to take corrective actions. Once the schedule is updated regularly, the critical path routinely shifts from one sequence of activities to another during the course of a project. Thus this method is the most efficient to track the progress, monitor and control the project.
To achieve timely completion of a project, the plan should be carefully prepared and should be bought of by all parties responsible for execution. All delivery lead times should be sufficient to avoid delay. Design should be released in the sequence of construction priorities at site. All permits from Government Authorities should be planned and applied for in advance. Construction interfaces should also be identified well ahead and requirement of resources should be planned against availability of the same.
Project Controls Group is an integral part of the construction project organization. A full project controls set up needs to be functional at the design office as well as at the jobsite to monitor the progress and take corrective actions. The group interacts with all other groups at jobsite as well as at home office to get information on all aspects of the project. The information is used to analyze and track the progress of the project, identify potential delays and raise a warning flag. If at all delays occur; schedule impacts are calculated, mitigations planned and they are well documented with proper responsibilities for performing delay analyzes.
Even with all careful planning for the project, as detailed above, delays may occur for various reasons. The following section will discuss on various causes of delays to help identify and analyze delays on a project.
4. CAUSES OF DELAY
Classified by responsibilities, the most common reasons for schedule delays are listed below:
4.1 Owner caused Delays
The responsibility lies on owner for these delays, as enumerated below:
¯Suspensions/ Terminations from owner
¯Owner directed changes in scope, schedule sequence or work methods
¯Owner’s interface for access, permits, design and material
¯Interface on inspection and approval with the owner
4.2 Third Party caused Delays
Depending on the assigned responsibilities per conditions of the contract, these may be accounted to the owner or to the contractor. For example, if it is the owner’s responsibility to obtain Government Approvals, delay will be owner caused. Various reasons are listed below:
¯Jobsite contractor interfaces
¯Approvals from Government/ Regulatory authorities
¯Delay in getting data from vendors for equipment
¯Delayed delivery of material from suppliers
4.3 Circumstances caused Delays
Reasons are listed below, which can be attributed to different parties, depending on the interpretations of the conditions of the contract:
¯Unanticipated subsurface conditions (Differing Site Conditions)
¯Force Majeure (Strike, Earthquake, Flood etc.)
¯Attitude of any one or both the parties
¯Rework of defects
¯Delays for providing adequate safety conditions at site
¯Manpower availability constraints – Qualitative/ Quantitative
¯Labor Productivity losses due to extreme physical conditions (Severe heat/ cold etc.)
Delays usually cause loss of money and time on the project. Depending on the parties responsible for the delays and the impact on schedule, delays are classified into five categories. Next section will discuss different types of delays and compensation applicable in terms of time extension or money or both.
5. TYPES OF DELAY
This section discusses different types of delays and respective compensation applicable but these are general guidelines only. Actual compensation depends on the conditions of the contract and the contract clauses must be comprehensively referred before proceeding with any delay analysis based on the facts discussed below:
5.1 Excusable/ Compensable Delays
The owner’s actions or inactions cause Excusable/ Compensable Delays. The contractor is entitled to time extension as well as damage compensation for the extra cost associated with the delay. Usually construction contracts have an implied obligation on part of the owner not to unreasonably delay, interfere with or hinder the contractor’s performance. Major factors that lead to the compensable delays are as follows:
5.1.1 Change Orders
The changes in the work scope or changes in the work method, manner or sequence of performance may require changes in the schedule or milestones. The change may have a direct impact on the schedule and hence the contractor has to be compensated for the delay resulting from the change and to be paid for the increased cost caused by the change.
5.1.2 Differing Site Conditions
The most risky latent condition in construction projects is the unknown sub-surface. The sub-surface or the latent physical conditions at the site may differ materially from those shown in the contract or the contractor may encounter unknown or unusual physical condition differing sharply from those usually encountered.
5.1.3 Suspensions
From time to time during the course of the work, it may be necessary or desirable by the owner to suspend all or part of the work. To be compensable, the suspension should in no way be caused by the wrongdoing or fault of the contractor.
Some examples of compensable delays caused by the owner are:
¯ Failure to release drawings necessary to maintain the contractor’s satisfactory performance
¯ Failure to release owner supplied materials to the contractor in time
¯ Not releasing access to the contractor to hold the work
¯ Interfering with the contractor’s schedule and ordering to proceed under conditions
¯ Supplying incorrect information, which misleads and disrupts the contractor in his
performance
¯ Failure to provide timely inspection of the contractor’s completed work
¯ Requiring the contractor to use any particular method when the contract does not
specify any particular method
¯ Failure to timely process invoices, change orders or amendments and contractor
submittals
If the owner directs the contractor to accelerate the work for the delay caused on owner’s part or due to Excusable Delay, the cost of acceleration becomes compensable. Excusable Delays are the delays caused by the Excusable Events that are out of control of the parties concerned and unforeseeable.
5.2 Excusable/ Non-Compensable Delays
Excusable delays are neither the contractor’s nor the owner’s fault. Both the parties share the risk and the consequences when excusable events occur. Contractor is entitled to time extension, including relief from any contractually imposed liquidated damages for the period of delay, but not to damage compensation.
The general intent here is to free the contractor from liability for the effect of a superior force that can not be anticipated or controlled, usually referred to as Force Majeure. This typically includes:
¯ Acts of God (Flood, Earthquake, Cyclone etc.)
¯ Strikes
¯ Extreme severe weather
¯ Fire
¯ Unusual delays in transportation
The following criteria should be fixed to constitute excusable delay, to avoid limiting the different events:
¯ Beyond the contractor’s control
¯ Without contractor’ fault or negligence
¯ Events unforeseeable
5.3 Non-Excusable/ Non-Compensable Delays
The contractor causes Non-excusable/ Non-Compensable Delays and assumes the risk for these delays. The contractor’s or its subcontractor’s actions or inactions cause these delays. Such delays could have been foreseen and avoided by the contractor with due care. The contractor is not entitled to any time extension or damages for this delay. On the other hand the owner may be entitled to liquidated or any other damages. However there is one gray area, which could turn out to be compensable delay from a non-excusable delay. Usually it is implied responsibility of the contractor and its subcontractors to foresee and plan for site interference with other parties working at site. However an unreasonable delay, even in the case of an event the contractor was advised to anticipate, can change a non-excusable delay to a compensable delay. Examples are:
¯ Failure of owner to provide timely inspection of completed work
¯ Failure of owner to competently coordinate the work of separate contractors
5.4 Concurrent Delays
Concurrent delay can be described as a situation when two or more delays occur at the same time during all or a portion of the delay being considered. The concurrent delay is excusable or compensable, this depends on the terms of the contract, cause of the delays, timing and duration of the delays, parties responsible for the delays and the availability of float.
In a particular scenario, both the owner and the contractor are responsible for two separate delays, which occur simultaneously and have equal duration, being on critical path. In this situation, the net point is that the contractor has not been held up by the delay caused by the owner. Therefore the contractor is not entitled to an extension of time. In the same breath, the contractor may face liquidated damages from the owner for delayed completion, even though the owner was not in a position to allow the contractor to complete earlier. In this case, the contractor will be entitled to time extension if he can prove that he could have accelerated the work but delayed due to advance notice from the owner. But the contractor will require delivering notice to that effect at an early stage.
In cases where a compensable delay and an excusable delay occur at the same time, the excusable delay will negate the compensable delay.
In case of concurrent delay, the most important action is to distinguish the impact of contractor delays from the impact of owner delays. Rights of the parties are mostly determined by delays on critical path. Hence the analysis should always be made whether the contractor was in fact prepared to proceed according to the schedule but for the owner caused delay or whether the contractor would have been delayed anyway for reasons within its own scope of responsibility.
5.5 Non-Critical Delays
Delays that do not upset project completion are Non-Critical. The delay may be large in duration but not critical if they could run parallel to other activities without being on critical path. But these delays may upset loading pattern for resources. Non-critical delays may deserve monetary compensation for extra cost involvement but there is no effect on completion date, unless they become critical due to the delay caused. This analysis of criticality should be performed for every delay occurrence on a project.
Delays usually create an ugly situation and lots of allegations and counter allegations are there from the parties involved. The following section discusses the various documents required supporting a delay analysis.
6. DOCUMENTS REQUIRED FOR DELAY ANALYSIS
None of the parties will easily accept the responsibility for the delay, unless there is valid document in support of that. Supporting documents for delay analyzes are very important, as the claim may be void in absence of proper support. Hence all documents and records should be well preserved for the project.
A few documents are listed below, which are of prime importance to perform and support the delay analysis:
¯ Approved Schedule : Approved schedule is a very important document as it is used as the baseline for the delay analysis and all distinct responsibility for the delay could be chalked out using this. The schedule should be reliable, accurate, reasonable and agreed by the parties concerned. Any mistake in schedule can cause the delay analysis to be rejected.
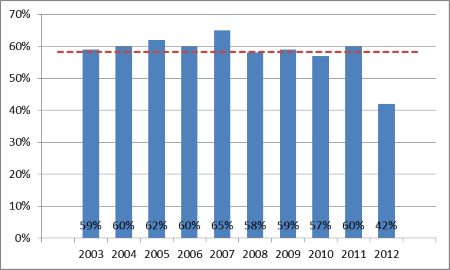
¯ Manpower and Equipment Histograms : The histograms provide basis for comparison for planned versus actual mobilization.
¯ Record of Design/ Material Release : These records form the basis for delay on account of deliverables from either of the parties.
¯ Progress Reports : All progress reports, whether Daily/ Weekly/ Monthly, can tell
into minute details about the working interfaces/ work put on hold etc. during that
particular period.
¯ Correspondences : Correspondences are very useful tool to find out the responsibilities at a later date and each of the parties should write letters for any delay or interface from the counterpart.
¯ Change Orders : Change orders detail out the scope of change and the analysis can be made for the delay/ cost escalation, based on the work involved.
¯ Trend Logs : A regular log of trends should be maintained to track all deviations, reasons for the deviations and schedule & cost impacts.
¯ Quality Non Conformance Reports : These could be used to detail out deficiency in
the quality of the work and the party responsible for that.
¯ Photographs : Regular jobsite progress photographs could tell the story in details with
the dates printed on them.
¯ Minutes of Meetings : Minutes of meetings contain formal details of all the discussions, agreements and disagreements during the meeting and hence very useful.
¯ As Built Schedule : This is of paramount importance. This could tell all stories that
happened during the life span of the project. It tells what event happened, when and
how did that affect the job performance. Activities should be incorporated into the
schedule for each individual cause of delay, logically tied with the impacted
activities.
After taking a look at the documents required analyzing and supporting delays, the following section discusses different methods to perform schedule delay analysis.
7. DELAY ANALYSIS METHODS
Schedule delay analysis is a complex process mostly and varies with the situation. The analysis of delay becomes more difficult when there are multiple causes of delay with interrelated effects.
As discussed earlier, the project schedule is the most widely used and the comprehensive tool for schedule delay analysis. Since the schedule gets updated regularly, all relevant details can be logged in to display them later.
Using computerized scheduling programs that are available in the market today, allow the project scheduler to keep track of:
¯ Actual start and actual finish dates.
¯ Suspension period for a particular activity, once activity started.
¯ Log records as the project progresses. All historical information can be entered for future use. They can be masked also for in-house reference and not to be visible in the prints.
¯ Activities can be coded as delay activities with individual responsibility for all the parties concerned. They can be filtered out later for analysis.
¯ Target bars can be shown against the current/ actual bars to make a visual comparison of the progress. Similarly a table can also be formed for the target dates and the current/ actual dates.
¯ Leaving aside the original schedule, copies can be made and analysis can be done for various scenarios arising out of the delay or change orders. The analysis can be seen quickly, even for large projects and networks.
¯ Pictures can be inserted in the layouts for effective visual display of some activities/ milestones.
Starting with the following page, this paper discusses few prominently used delay analysis methods.
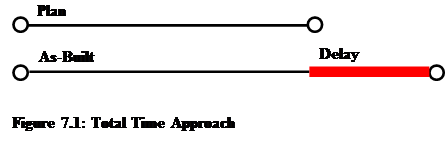
7.1 Total Time Approach
Total Time Approach is the basic method as shown in Figure 7.1. Here the comparison is made for As Planned bar chart against As Built bar chart. The difference calculated is the delay duration. The obvious difficulty with this method is that it does not show the causes for the delay and thus who is responsible. Also it does not show the effect of the delay. It is a subjective method and difficult to analyze using this method.
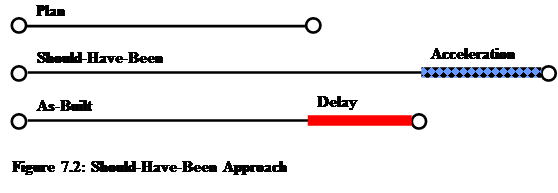
7.2 Should-Have-Been Approach
Should-Have-Been condition is implied to the original plan, in this approach, for the various reasons of lesser productivity (See figure 7.2). Then period of acceleration is deducted and delay duration is arrived by comparison against the original plan.
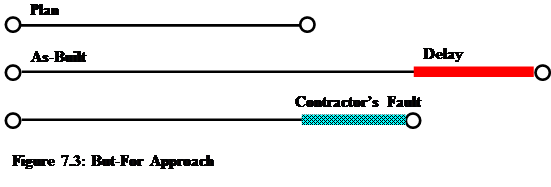
7.3 But-For Approach (Collapsed As-Built)
In But-For Approach, all owner caused delays are deleted from the as built schedule to analyze what would have been But-For the owner caused delays as depicted in figure 7.3. Then the difference between But-For Schedule and As Built Schedule tells the scope of owner caused delay for time as well as for cost. This method does not account for criticality/ non-criticality of the activities for the effect of this realignment.
7.4 Time Impact Analysis
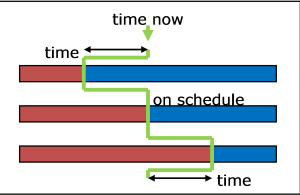
Time Impact Analysis was already discussed earlier in Section 3. Detailed schedules are used and critical path analysis done in this method. It shows effects of each individual delay and the actual progress. Difference can be visible between the two schedules using approved schedule as target schedule. This is a proven and successful method and widely used in the construction industry.
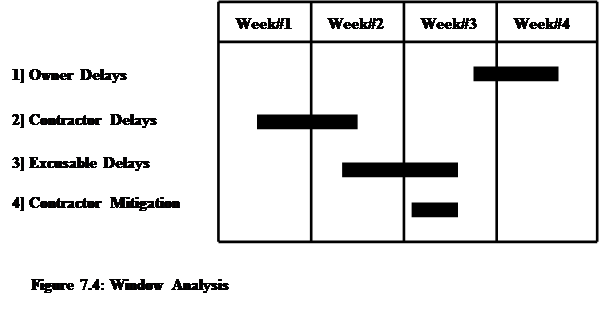
7.5 Window Analysis
Window Analysis is a pictorial presentation and information is taken mainly from updated/ as built schedule with support from the various documents mentioned in section 6. The basis for determination of delay analysis window is the best judgement and the periods of delay. Figure 7.4 shows a sample format for window analysis. Events are identified on the critical path, in the window. The comparison is made for the planed against as built durations for the activities. Here a better account can be taken for the concurrent delay and we can superimpose the delays on a single bar clearly showing the effect of each delay and responsible parties. This is a very accurate approach to analyze complex delay situations and the best advantage is the effective visual presentation.
Since window analysis has the advantages of clarity and effective visual presentation, this is widely used on construction sites for the delay analysis. To explain this method in details, a delay analysis case study will be discussed, for which window analysis method was used. The author while working with a contractor as a planning engineer did the analysis. In this case the contractor was delayed by two owner invoked suspensions on the pre-commissioning activities of the contractor.
8. CASE STUDY
The subject of discussion is a delay analysis, faced while constructing a Gas Based Combined Cycle Power Project. The contractor was awarded Lump Sum Contract to design, procure, build, commission and hand over the plant to the owner in a time span of 27 months from the date of Notice To Proceed. Per the terms of the contract, the contractor had to pay a Liquidated Damage of US$ 150,000 per day of delay. On the other hand, the contractor would have been eligible for an Early Completion Bonus of US$ 80,000 per day, for completion ahead of the Contractual Completion Date. For discussion in this paper, the contractual completion date will be referred as the Guaranteed Completion Date. For analysis, say, the Guaranteed Completion Date was agreed as 07 Jun 2000.
The project comprised of the following:
¯ Two Combustion Turbines & Generators (CTs & CTGs), named CT 2A/ 2B &
CTG 2A/ 2B.
¯ Two Heat Recovery Steam Generators (HRSGs), named HRSG 2A/ 2B.
¯ One Steam Turbine & Generator (ST & STG).
An internal target was set by the contractor to complete the job in 25 months i. e. 60 days ahead of the guaranteed completion date, referred to as Target Completion Date. On completion per target completion date, the contractor would have been eligible for an early completion bonus of 60 days, per conditions of the contract. A detailed schedule was prepared to achieve the target completion date in consultation with all responsible parties associated with the project. The schedule was delivered to the owner with the internal target milestone dates and the owner agreed to support with all the deliverables on their account to support the schedule to help the contractor achieve the target.
The contractor started the work per schedule and the schedule was continually reviewed on a weekly basis to status for progress. Supporting critical path reviews were also carried out. The contractor used to send the updated schedule regularly to the owner, to appraise of the latest developments and to make aware of the expectations from the owner to support the schedule.
Construction of the project progressed well and after achieving all milestones of construction, entered into pre-commissioning phase. During construction phase, the schedule slipped against the target one for various reasons, and that is out of the subject of this discussion.
Before proceeding further, it is imperative to discuss the sequence of pre-commissioning activities falling on critical path, leading to handing over of the project. The First Fire of the combustion turbines is referred to as the milestone activity when the CTs are test run for the first time with fuel on a project. This activity of First Fire triggers the sequence of following activities, typically on a power project of the same configuration as mentioned above:
¯ Synchronization: Testing of the CTs at full speed and running on full capacity after synchronization of the CTGs with the electricity distribution grid.
¯ Steam Blows: Steam is blown through the HRSGs and associated piping using temporary pipes, to clean the system to a certain specification.
¯ Restoration: Once steams blows are completed, temporary pipes are all removed. All permanent pipes, fittings and valves are installed and control system tubes are flushed to required specification.
¯ Function Checks: All control systems are checked in a comprehensive manner. On completion of this activity, the CTs can be refired with fuel.
For ease of discussion here, the above set of activities is referred to as Activities Leading to Refire of CTs. In this case, this set of activities was totally under control of the contractor and was not affected by any direction of the owner.
The Refire of CTs is another important milestone activity which refers to the rerun of both the CTs with fuel, to perform further testing & commissioning, leading to Handing- Over of the project. Typical sequence of activities to follow after Refire of CTs listed below:
¯ Set Safety Valves on HRSGs: The safety valves are first tested and set per operational specification.
¯ ST Roll: Steam Turbine is rolled for the first time, feeding steam into the turbine. After this activity, various checks are done on the turbine & generator and it is synchronized with the electricity distribution grid.
¯ STG Loading: Steam Turbine & Generator is loaded @ incremental load of 25%, 50% and 100%.
¯ Plant Tuning: Fine-tuning is done for the plant to achieve maximum efficiency. After that the plant is shutdown for removal of the screen from the valves, installed to check impurities going into steam turbine. This shutdown period is also utilized for water wash of the CTs.
¯ Plant Operation/ Test & Hand-over: Finally the plant is continuously run and a battery of test needs to be carried out in the presence of the parties involved, per specifications. On satisfactory completion of the tests, the plant is handed over to the owner.
Coming back to the case, the contractor was in the process of completing the Activities Leading to Refire of CTs when a suspension (Suspension#1) was invoked by the owner on Refire of CTs. Shortly after that, the second suspension (Suspension#2) was invoked when the contractor was about to Refire the CTs. To analyze the delay due to the suspensions, four schedule snapshots were taken:
¯ On 17 Mar 00, Status prior to suspension#1 in place
¯ On 06 Apr 00, Status after suspension#1 lifted
¯ On 10 Apr 00, Status prior to suspension#2 in place
¯ On 13 Apr 00, Status after suspension#2 lifted
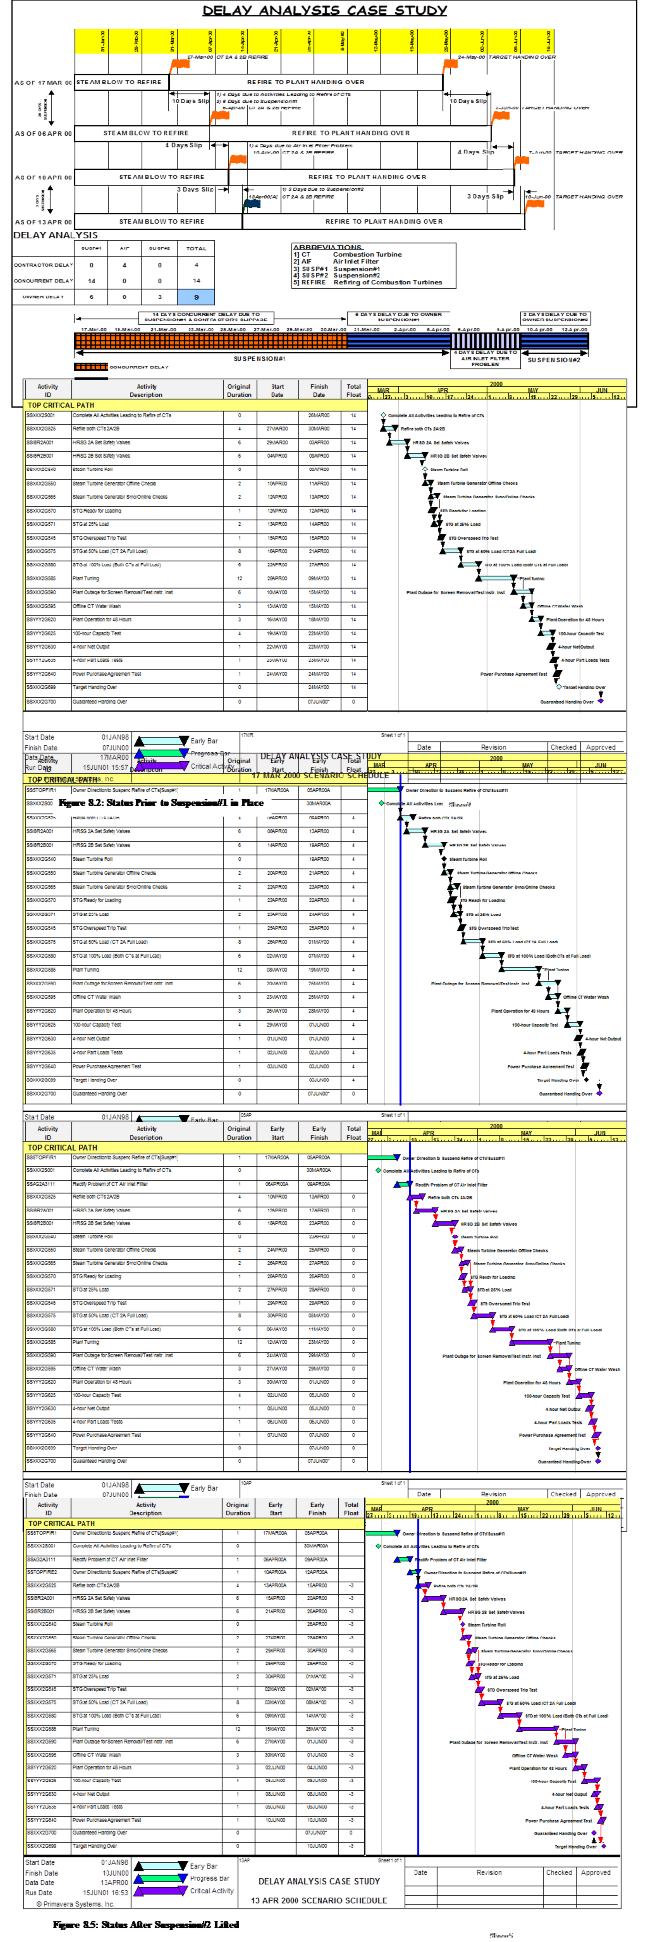
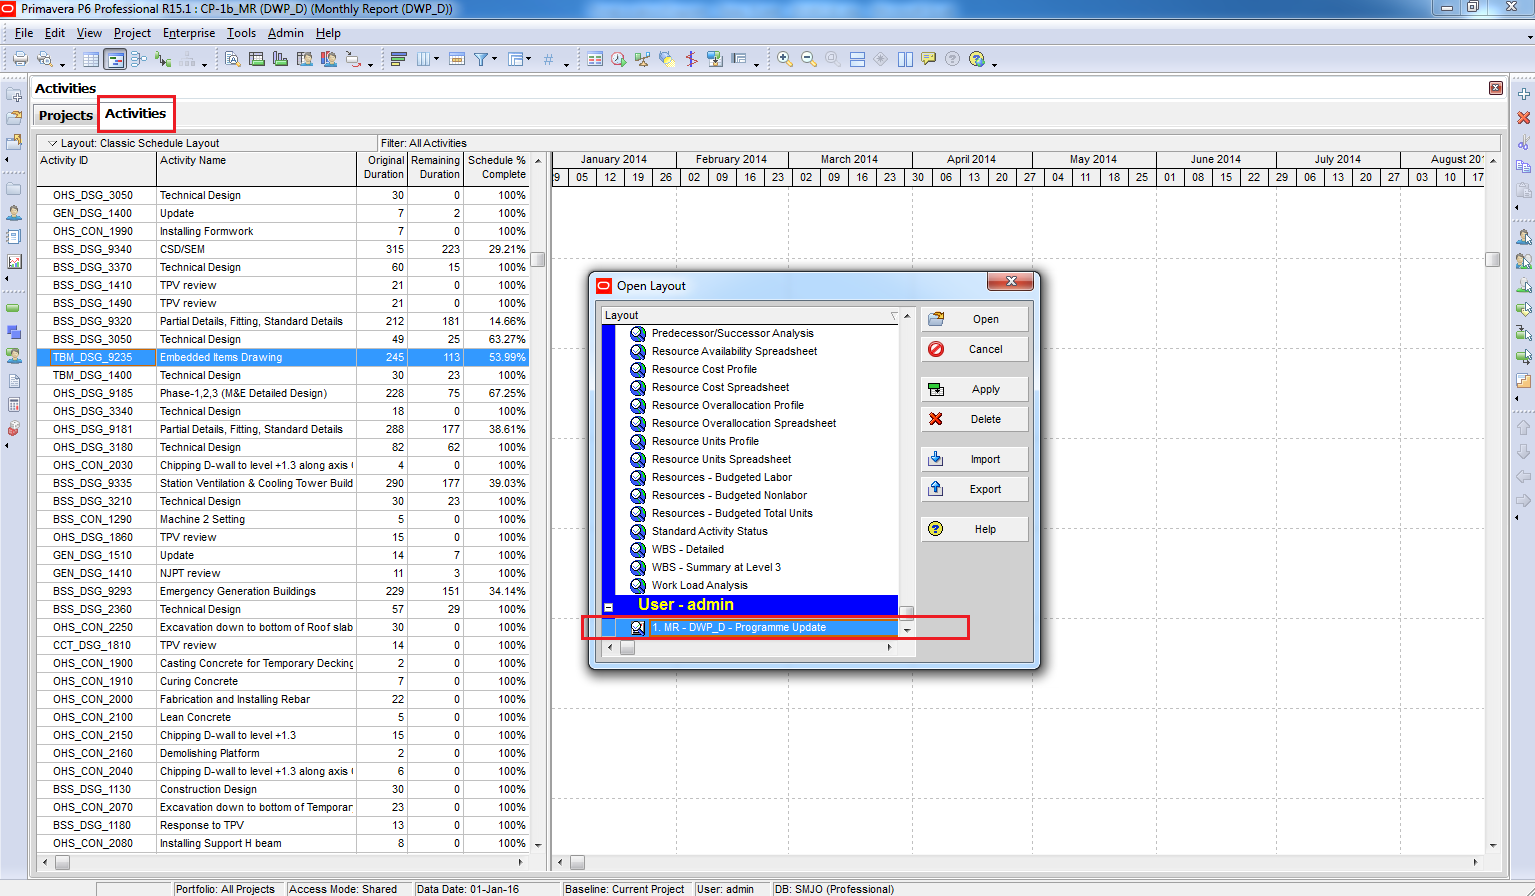
The schedule on the project was developed using Primavera Project Planner software. As a back up to window analysis, the activities falling on the most critical path are shown in the figures 8.2, 8.3, 8.4 and 8.5 for reference. Each one is a schedule, statused on different dates as mentioned above.
Identification number, description, duration, early start, early finish and total float is shown for each activity on the schedules. Bar area shows timescale on top and activity descriptions are marked on bars also for clarity. Activity interrelationship lines are visible in the bar area.
Since the owner directed to put a hold on Refire of CTs during suspensions, window of the delay analysis was selected from Refire of CTs to Handing Over the Project to the Owner. There is a focus on Activities Leading to Refire of CTs too, as the project got delayed due to that activity. Figure 8.1 on page no. 34 depicts the window analysis. Microsoft Excel software was used for the analysis as different types of shapes could be used easily to make an effective pictorial presentation.
The window analysis shows summary of one schedule snapshots on each bar, presented graphically. Each bar is divided into two parts. One is Steam Blows to Refire of CTs and the other is Refire of CTs to Handing Over. Flags are used to display refire and hand over. Each bar shows successive slippages against timescale for the period ending, mentioned on top.
The composite bar at the bottom of the window analysis identifies delay types and responsibilities for the date marked on it. A table shows the delays with accountability and total of the delays.
The float, stated in the discussion at all places, is against the Guaranteed Completion Date of the project. As mentioned earlier, this date was the key for calculation of early completion bonus or liquidated damages. All the four schedule snapshots and the delay impacts are analyzed below, one by one:
8.1 Status Prior to Suspension#1 in Place
On 17 Mar 00, Suspension#1 was slapped on the contractor as the owner failed to get some statutory approvals from Government Authorities, which was solely on their account.
First schedule snapshot was taken just prior to suspension#1 in place, as shown in figure 8.2 on page no. 35. Refire of CTs was scheduled for 27 Mar 00 on this date. With this forecast date for refiring of the CTs, the date for Handing Over was forecast to take place on 24 May 00. There was a float of 14 days to achieve early completion bonus.
8.2 Status After Suspension#1 Lifted
The owner lifted Suspension#1 on 06 Apr 00 as they got some interim approval from the Government Authorities. The schedule status is shown in figure 8.3 on page no. 36.
In the mean time the contractor slipped by 4 days in completing the Activities Leading to Refire of CTs and could be ready to Refire the CTs only on 31 Mar 00.
The suspension#1 stayed for a total period of 20 days and even though the contractor was ready to refire the CTs on 31 Mar 00, they could not do that as the suspension#1 was still in place then. Hence the period of 20 days (17 Mar 00 to 05 Apr 00) could be divided into two parts:
¯ 17 Mar 00 to 30 Mar 00 (14 days) was a window of concurrent delay, as the contractor could not be ready to refire the CTs.
¯ 31 May 00 to 05 Apr 00 (6 days) was a window of excusable/ compensable delay as the contractor was ready to refire the CTs but could not do, per direction of the owner.
After suspension#1 lifted, the refire of CTs was scheduled to be on 06 Apr 00 and the date for handing over of the project slipped straight to 03 Jun 00. Float reduced to 4 days from 14 days.
8.3 Status Prior to Suspension#2 in Place
Another schedule snapshot was taken just prior to suspension#2 in place on 10 Apr 00, as shown in figure 8.4 on page no. 37. At that point of time, the contractor was just ready to Refire the CTs. Delay for 4 days on the contractor’s part is detailed below.
As the contractor got the Suspension#1 lifted and went ahead to refire the CTs on 06 Apr 00, a snag got developed in the Combustion Turbine Air Inlet Filter. Air Inlet Filter is an important component for firing of a CT, as it filters the air before it comes to CT to get mixed up with fuel for combustion. All efforts were made by the contractor at this late stage to rectify the problems. This took 4 days on the critical path to correct and was totally on account of the contractor and thus non-excusable delay. This non-excusable delay caused to push the refire of CTs on 10 Apr 00 and the handing over date to the same 07 Jun 00 as the guaranteed completion date. The float reduced to zero.
The problem was fixed on air inlet filter and the contractor was about to Refire the CTs. At this juncture, the owner invoked Suspension #2. The suspension directed again to stop refire of CTs and it was again for the owner’s failure to get through with the Government Authorities.
8.4 Status After Suspension#2 Lifted
On 13 Jun 00, the Suspension#2 was lifted by the owner and the same day the CTs were refired. The schedule impact of suspension#2 is shown in figure 8.5 on page no. 38. This delay of 3 days due to suspension#2 was a compensable one. The delay caused the project handing over date to push out of the guaranteed completion date of 07 Jun 00 and that went over to 10 Jun 00. Thus the float was negative three days on the project.
On analyzing, it was found that the contractor had lost ground for 14 days of concurrent delay. The contractor issued the notice of delay to the owner in time, against the notice of suspension#1 invoked by the owner, but failed to be ready to refire the CTs early and hence no time extension claim was possible for the Concurrent Delay of 14 days.
But-for the contractor’s delays, clear Compensable Delays from the owner was on two occasions:
¯ Suspension#1: 31 Mar 00 to 05 Apr 00 (6 days)
¯ Suspension#2: 10 Apr 00 to 12 Apr 00 (3 days)
For compensable delays, the contractor was entitled for a total of 9 days of Time Extension against the Contractual Completion Date. In addition to that the contractor was entitled for the Reimbursement of Cost Overruns for this period. As the contractual completion date was getting extended, there was no effect on the entitlement of the contractor’s early completion bonus.
9. CONCLUSION
The author has aimed to clearly bring out the significance of schedule tracking and accurate record keeping for delay claims and counter delay claims. It is imperative that the Project Schedule be closely monitored and maintained to reflect the latest status and simultaneously have a good record of delays caused and parties responsible for these delays. The documentation ultimately serves as the tool for the contractors to put forward their case of delay analysis. This readiness to present the case any time will minimize to a large extent, the acrimony and disputes that occur at the end of the project. On fast track projects, this can make a substantial difference between making and loosing money.
The Project Controls Group has to ensure that the schedule is well tracked and reports get turned in regularly. This can happen only when a full project controls group is functional and interacts with all concerned with the project and get various reports in time. This would help all opportunities for extra cost involvement to get translated onto the company’s gross margins and thereby put a big smile on the management’s faces.
Various tools are available for schedule delay analysis, but the use of Window Analysis to achieve the means has a high utility factor associated with it. It is very lucid for the onlooker and graphically portrays the delays and the responsibilities. A clear picture will emerge from this analysis, when it is supported by solid back ups like schedule critical path analysis and other relevant documents. This assumes special significance for Contractors on Lump sum Contracts, where the better armed the contractor is with proper analysis supported by back ups, the better he can fight his case. Schedule extensions and associated costs, granted as a result of meticulous analysis, could make the cash register jingle.
BIBLIOGRAPHY
¯ Unpublished company handouts for Contracts Management Seminar.
¯ Unpublished company handouts from Project Controls University Classes.
¯ Skills & Knowledge of Cost Engineering – 4th Edition by Dr. Richard E. Larew
 Australia
 International


 Blogs
Blogs Glossary
 Templates
 Videos
 Paperback Literature
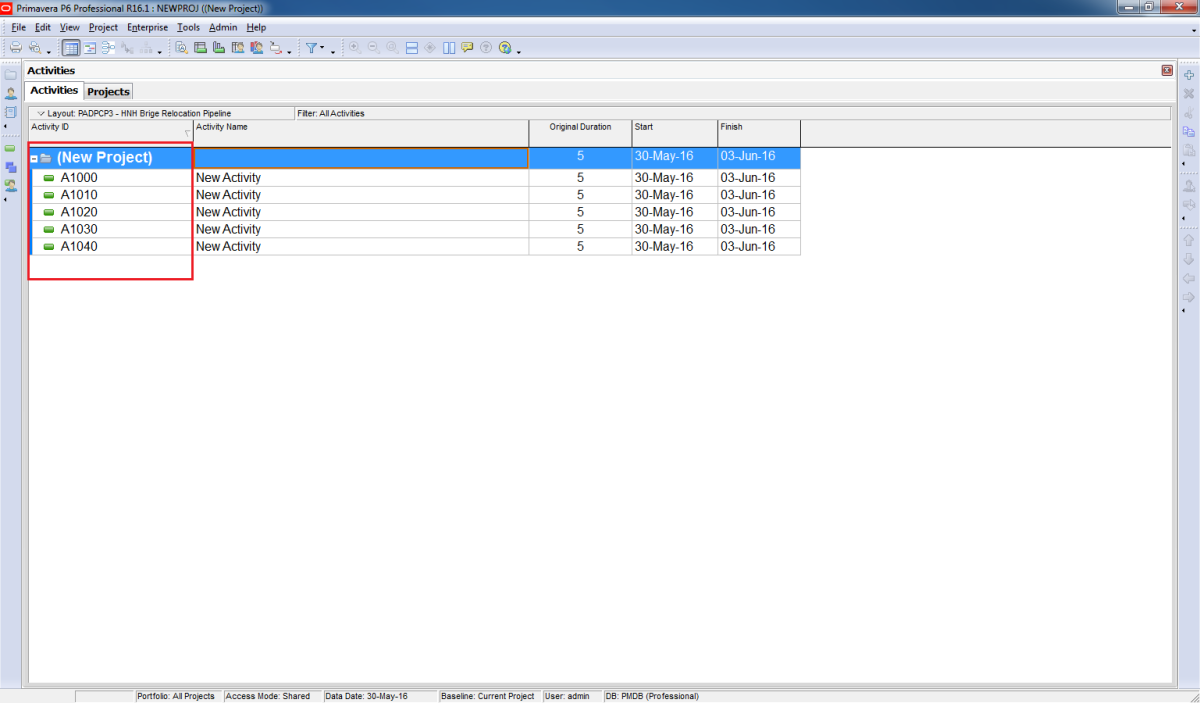


 ………………………


