Optimizing engineering cost necessarily means Increasing Productivity, without shifting focus from the quality, i.e., improving the overall Performance of Engineering. To improve performance, the current level of performance and target level of performance must be known, and then only one can try to approach towards the goal (target). Thus, it is imperative to have a comprehensive and credible Performance Tracking system. The traditional approach was to measure Engineering Performance in terms of Schedule and Jobhours only. Schedule performance provides the progress with respect to schedule while Jobhour performance gives the relative earnings with respect to spent hours. By measuring merely these two parameters, the real performance in respect of savings / loss to the project due to design development and cost of engineering were not being monitored. So, a comprehensive approach is required to measure the overall Engineering performance taking the latter two factors into the account, so that the corrective actions are in right area at right time.
Thus, The author recommends adopting more comprehensive approach and measure Cost and Quantity performances as well. The conventional measures (Schedule and Jobhours) combined with the two advanced measures (Cost & Quantity), provides the true overall Engineering performance. For having a balance, 50% weightage is assigned to traditional measures and 50% to the new measures. Suitable weightages, based on their relative importance for a project, are assigned to the individual parameters and the final performance number is reached. This is named as Dashboard Performance and the metrics is named as Dashboard metrics. As the name implies, like a car Dashboard, this shows all the important parameters necessary for monitoring the Engineering performance at one go.
By measuring Dashboard performance, a project will always be aware of the key performance parameters and can take timely corrective actions in the problem areas. This will ensure that there are no surprises and schedule / cost overruns. The dashboard discussed here is though applied to measure / improve performance of Engineering on a capital project, the measuring parameters can be suitably customized and the dashboard can be prepared for other types of activities or projects or a company as a tool to measure and track the performance. Taking clue from the Engineering Dashboard, Procurement Dashboard has already been devised and is in use.
1.0 INTRODUCTION
EPC industry, though growing steadily after the World War II, has off late started showing signs of uncertainties. Though, vast multitudes of projects have sprung up, a fierce competition has been set up among the contractors. A project is typically a series of activities that have a specific objective to be completed within certain specifications and the start/ end dates are well defined. The construction projects are usually capital intensive with a lot of debt and interest components and everyone wants to earn as much profit on the investment, as possible. These facts have made EPC execution very challenging with full of risk and uncertainties. However, a general contractor has no choice but to accept it. Thus, the challenges ahead for EPC contractors are how to manage the risks efficiently and optimize the cost of various phases of the project to retain their margins. This paper discusses an effective method of monitoring and optimizing performance of Engineering phase of a project.
A reader will be very curious to know why the author has chosen Engineering as focal point when most of the money spent on a project is on other phases than Engineering. Author does agree to the fact but at the same time would like to emphasize that improving engineering performance necessarily means optimizing cost of all other phases of a project. For an EPC contractor, though all phases of a project, viz. Engineering, Procurement, Construction and Commissioning are of equal importance, the Engineering phase has got a certain edge over all others. Engineering being the originator of ideas, design and specifications; Procurement, Construction & Commissioning phases are heavily dependent on it. Good engineering means, more certainty and hence less risks on a project. Following are some of the key benefits by the improved Engineering performance to various phases of a project, which prompted the author to concentrate on Engineering phase only and discuss on improving the Engineering performance.
Engineering:
Ø Good performance will ensure no re-work in engineering phase resulting savings in Engineering Cost and timely deliverables to Construction.
Ø On schedule Engineering Progress will facilitate timely release of expert Engineering staff for other projects.
Procurement:
Ø No surprises – Detailed and Accurate Datasheets / specifications. No change orders.
Ø More time to negotiate & reduce the cost.
Ø Accurate Bill of Materials – Avoid under / over procurement of bulks.
Construction / Commissioning:
Ø Timely availability of quality drawings – Ensuring Pre-planning / Avoiding idling cost.
Ø Constructability reviewed - Ensuring minimum cost with safe & right Construction sequence.
Ø No re-work –Avoid re-work cost & ensure high morale of site staff.
Ø Timely turnover from Construction to Commissioning – Keep Commissioning group focused and pro-actively involved to adhere to the schedule.
Further, the improved engineering performance is utilized on following specialized streams to maximize the benefits-
Value Engineering – This is one of the most important concept of modern engineering practices and is of equal importance to both the general contractor and owner. Value engineering goes
beyond a normal design or constructability analysis and pro-actively addresses the design concepts that yield the least life cycle costs or provide the greatest value while meeting all the functional criteria. Thus, this is of prime importance to an owner because ultimately it reduces the Total Cost of Ownership (TCO).
Proposal Engineering – This phase of engineering is of key importance to an EPC contractor because it is the basis for his quote in winning a job and thus deciding a job booking which directly affects contractor’s future & growth.
The above discussions clearly illustrate the exceptionally important role of engineering in an EPC business. So, it is worth discussing Engineering performance & it’s improvement methods.
The author being in Project Controls group has done many Engineering and Construction projects and has monitored engineering performance closely. While doing this, the author observed the following facts –
i) Engineering is done by qualified and sophisticated people with sophisticated tools / software’s.
ii) The people and tools used for engineering are quite costly, so even a small Increase in the performance will result in considerable amount of savings.
iii) The general practice was to measure performance of Engineering through Schedule and Jobhours.
iv) Many times Engineering phase ran over budget even though Schedule and Jobhour performances were showing good numbers (<1).
v) The wage rates of each employee being different, Jobhour performance was not capable of identifying the cost overruns in Engineering budget.
vi) Sometimes, though Engineering was completed within budget, projects lose money due to increase in estimated quantities (called as burst in quantities).
vii) The Schedule & Jobhour performances are very important but doesn’t indicate the quality of the design, i.e., the design is going to save / loose money for the project.
These observations prompted the author to find more comprehensive and credible method for measuring the Engineering performance so that it could be used for controlling the projects more effectively. Further sections will describe further work on this.
2.0 PERFORMANCE MEASUREMENT
The author recognizes that the role of Project Controls is to provide constant surveillance on project conditions to effectively and economically ensure a ‘no surprise’ condition.
So, the author worked on finding the ways to control the performance of Engineering and noted that Tracking the Performance with right parameters could be one of the most effective tool to improve it because – You can’t tell when you’re winning or losing if you don’t keep score.
The author then concentrated to devise a tool / metrics which when measured could give the real performance of Engineering, covering all the aspects of a project. Based on the observations made on various projects the author concluded that two more key parameters should be added in the list of monitoring to measure the real nerve of Engineering –
Ø Cost Performance
Ø Performance of Bulk Quantities
Once these were identified, the methods to define, integrate and measure the above parameters were thought of. Further sections will define the each parameter, it’s weightages and method of measurement in detail, followed by a case study to make it clear how it helped the author to improve his Engineering team’s performance. It is prudent to mention that a company can formulate it’s own parameters based on the importance of the parameters in his business.
3.0 CONVENTIONAL MEASURES
As discussed earlier, conventionally (before adopting the current approach), only Schedule and Jobhour performances were measured. To understand these two, one has to first be familiar with terms described in the following section.
3-1. THE FUNDAMENTALS
Baseline Schedule (Target Schedule) – The schedule set as baseline for measuring the project’s progress. This is usually frozen in the early stages of a project and is not revised unless there are some major changes forcing the schedule to be unrealistic.
Current Schedule – Once the target schedule is finalized, it is updated and controlled at regular intervals (weekly or monthly) to know the status of the progress and critical path analysis. This schedule is called the Current Schedule.
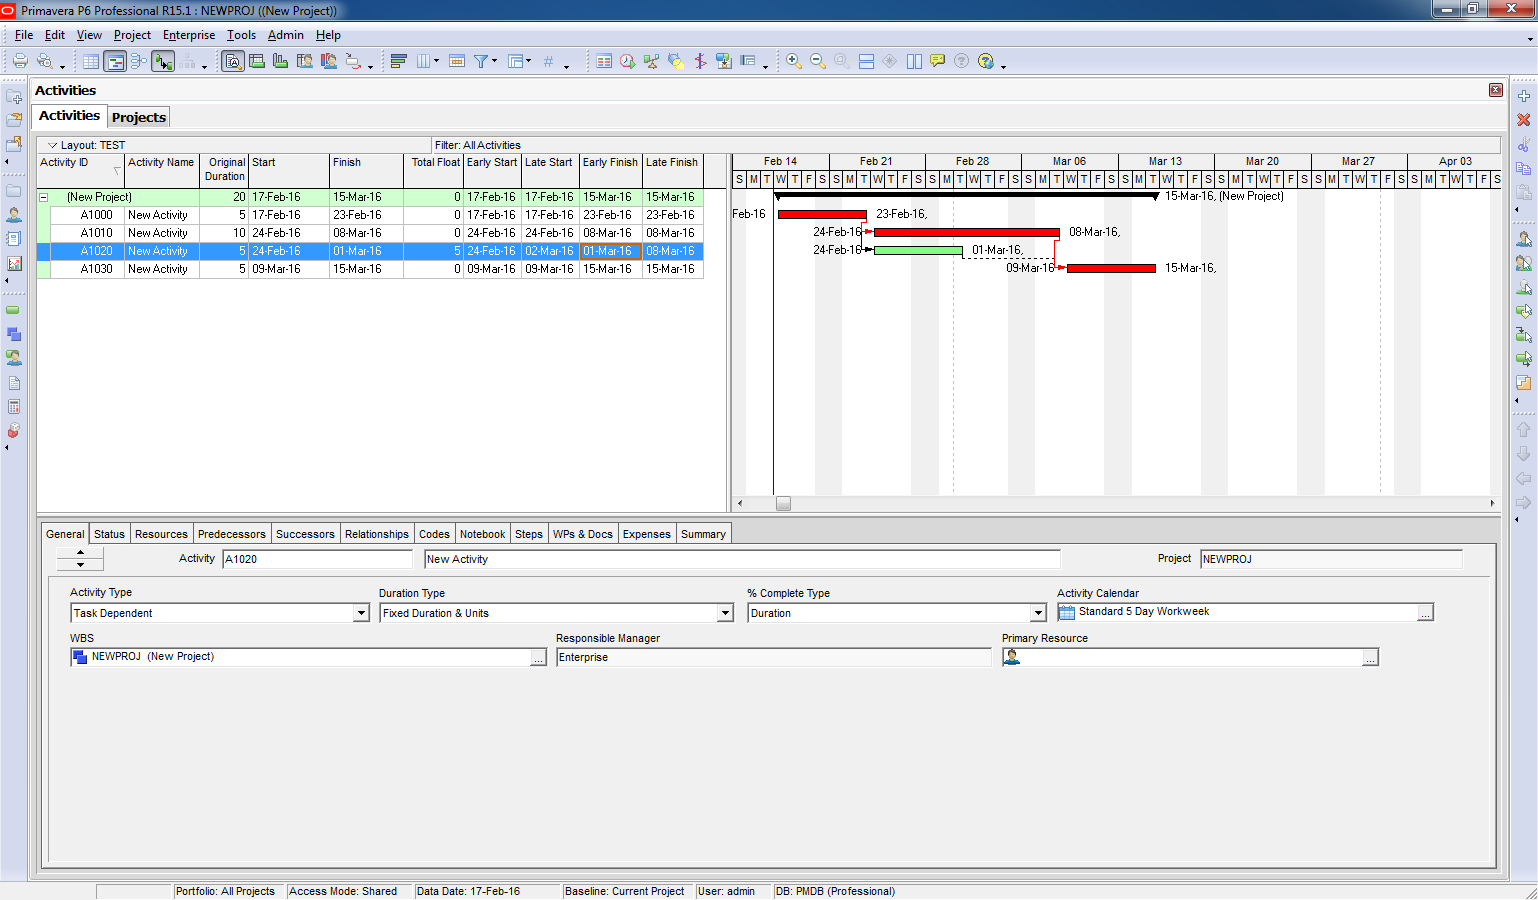
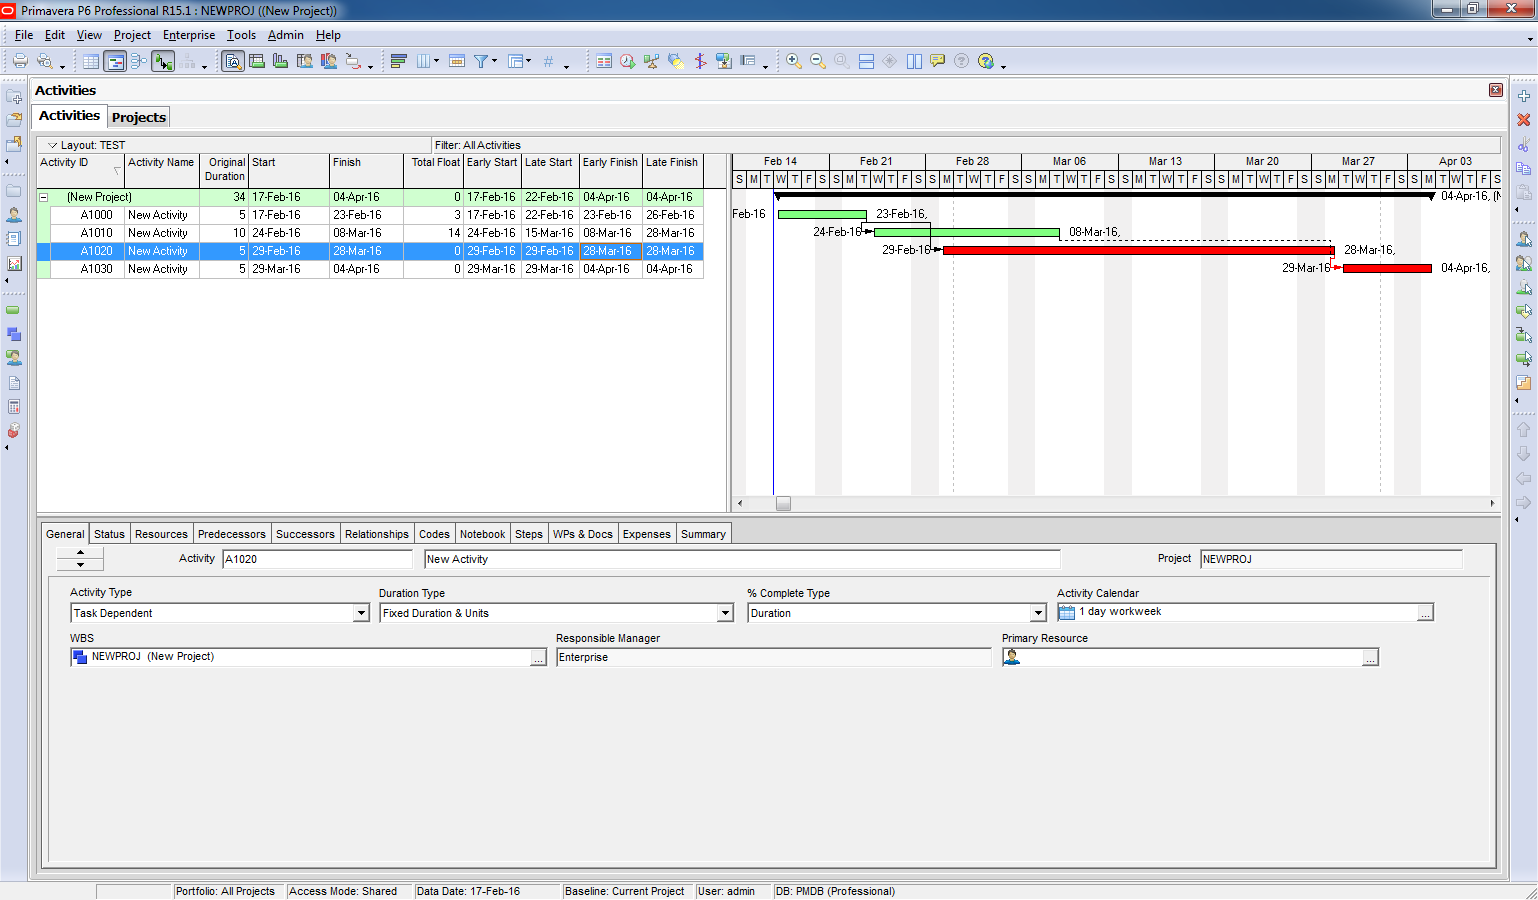
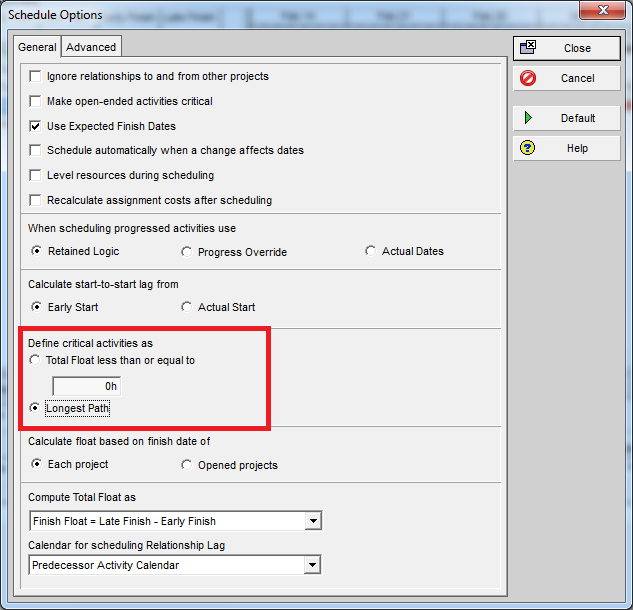
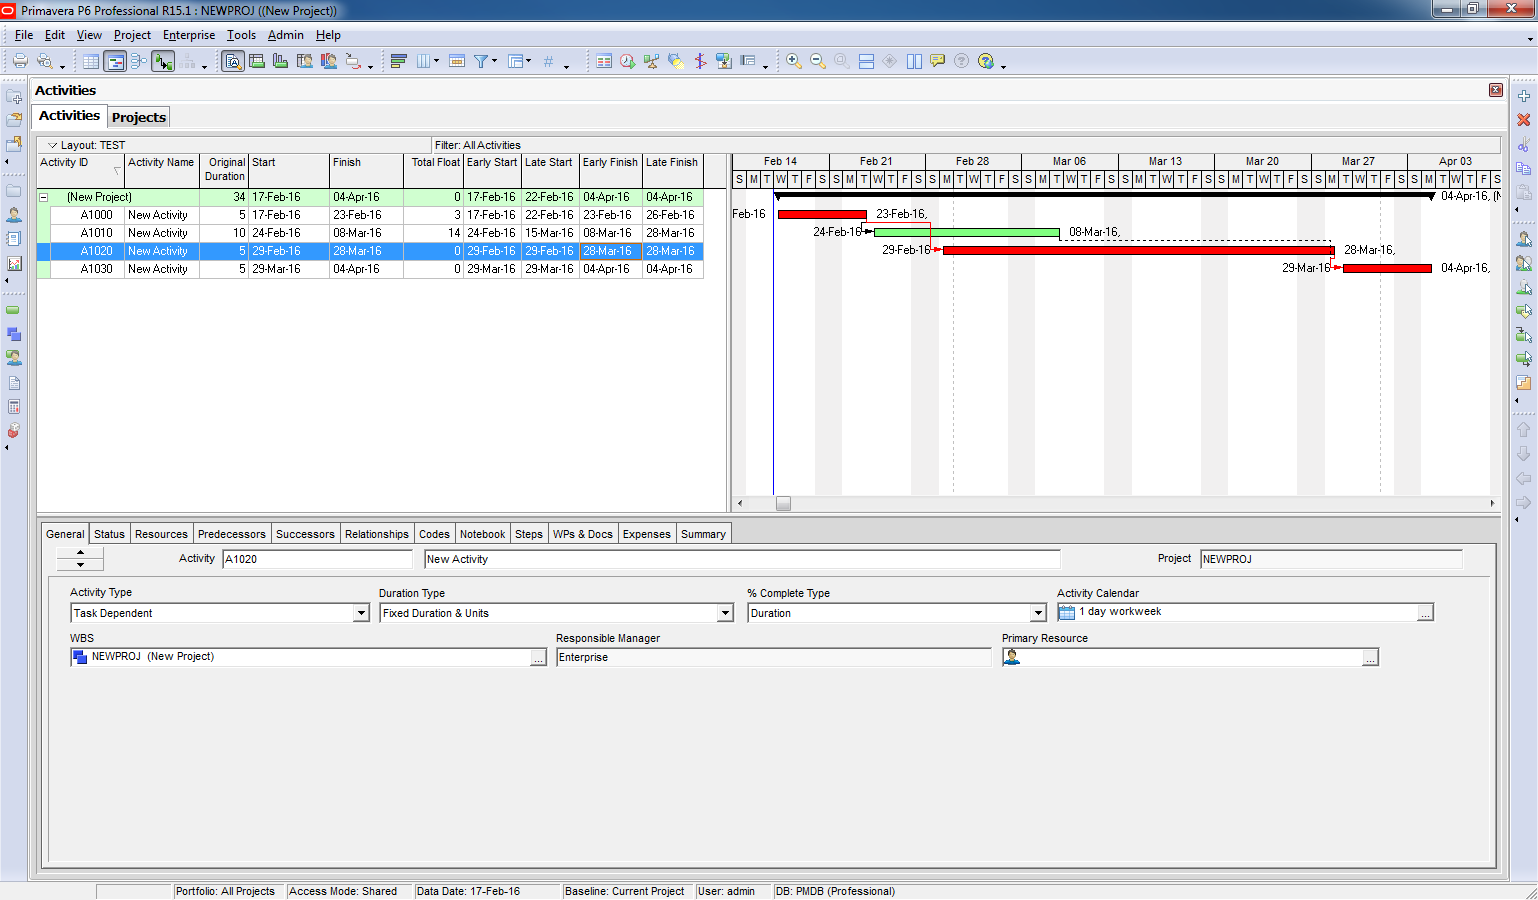
Critical Path – In CPM (Critical Path Method) scheduling, activities are linked based on their sequence of occurrence. Critical path is the longest chain of activities and has the least Total Float (usually 0). Thus, all the activities on Critical Path must be closely monitored, because delay in any of the activities on this path directly results the delay in project completion.
Total Float - In CPM scheduling, this is defined as Late Finish date (the latest date by which an activity can be completed without affecting the project end date) minus Early Finish ((the earliest date by which an activity is expected to be complete). A negative (less than 0) Total Float implies that project end date can not be met and immediate recovery plan is required to catch up the critical activities.
Schedule Percent Complete - At any point of time, the percentage complete with respect to the target schedule is know as Scheduled percent complete. Calculated as ratio of budget job hours scheduled to total budget job hours.
Actual Percent Complete - At any point of time, the actual percentage complete for an activity. This is usually maintained in the current schedule. Calculated as ratio of Jobhours earned for the work performed to the total budget job hours.
Percent complete for any account = Earned Hours in the account / Total budget in that account
Earned Hours – Earned hours are defined as the hours earned on account of progress made.
Scheduled Earned Hours (BCWS) = Scheduled percent complete x Budget Jobhours. This is extracted from the Target schedule.
Actual Earned Hours (BCWP) = Actual percent complete x Budget Jobhours. This is derived from the Current schedule.
These values are calculated either by maintaining a spreadsheet of Scheduled budget and Actual Earned Jobhours. The modern schedule management software’s have the facility to directly extract this information.
Actual Spent Hours – The hours actually spent and paid for on an activity, account or job. This is generally tracked by payroll (Finance) and Project Controls receives the data as and when the payment is made / invoice is raised.
3-2. SCHEDULE PERFORMANCE
Schedule performance is ratio of Scheduled earned hours to Actual earned hours.
Schedule Performance = Schedule Earned Hours (BCWS)/ Actual Earned Hours (BCWP)
Thus, When SP >1, project is lagging behind schedule.
When SP<1, Project is ahead of schedule.
When SP=1, Progress is as planned. However, Critical Path must also be checked (esp. if Total Float is <1) so that focus is not shifted on non-critical activities.
Schedule Performance indicates / alerts for the followings-
i) The current status with respect to the Original Plan.
ii) How realistic the Target schedule is.
iii) Disciplines / Areas needing more attention.
iv) Focus & commitment of the Engineering team.
v) The forecast completion of the project (based on the current trend).
Requirements:
The main pre-requisites for measuring the Schedule Performance are described below
i) Agreed and realistic Target (Baseline) schedule with resource loading.
ii) Well-defined Progress measurement methodology.
iii) Resource loaded Current schedule – being updated at regular intervals.
iv) User-friendly spreadsheet / software to calculate the scheduled and actual earned values.
v) The Engineering team understands the schedule.
Advantages:
Regular measurement and analysis has following effect on a project -
i) Immediate alert on the slippages.
ii) The reasons for shortfall can be ascertained and timely corrective action can be taken.
iii) Focused Engineering team.
iv) No holds for Procurement & Construction.
v) Time for Constructability review of designs.
3-3. JOBHOUR PERFORMANCE
Jobhour performance is the ratio of Jobhours Spent (and paid) to the Jobhours earned due to work performed / progress made.
Jobhour Performance = Actual Spent Hours (ACWP) / Actual Earned Hours (BCWP)
Thus, when JHP >1, project is working inefficiently and consuming more hours than budgeted.
When JHP<1, Project is efficient and earning money. Productivity is high.
When JHP=1, No savings, earnings are being paid for the work done.
However, if cost is not tracked, a situation may come where Jobhour rates being too high cost budget may get exhausted, even though Jobhours are left in surplus.
The Jobhour Performance indicates the followings-
i) The current status of spends with respect to budget.
ii) The software utilization.
iii) The current level of Productivity / Efficiency.
iv) How realistic the budgets were.
v) The problem areas (causing idle hours or re-work) needing more attention.
vi) How motivated the Engineering team is.
Requirements:
The main pre-requisites for measuring the Jobhour Performance are listed below-
i) Pre-defined Progress measurement methodology.
ii) Resource loaded Current schedule – being updated at regular intervals.
iii) User-friendly spreadsheet / software to calculate the scheduled and actual earned values.
iv) A credible mechanism to capture the actual Jobhours charged by the employees in different accounts.
Advantages:
Regular measurement and analysis has following advantages to a project -
i) General trend of Productivity is readily known.
ii) Timely corrective actions can be taken to avoid impact on Procurement & Construction phases.
iii) The reasons for poor performance are investigated & corrective actions taken.
iv) The Engineering team is cautions of their performance, hence focus to the work.
v) The productivity rates can be used for historical records.
4.0 ADVANCED MEASURES
Though a lot of useful inferences were made and improvements implemented by measuring the Schedule and Jobhour performances, the following still remained areas of concern–
Ø How to know if there is any cost over run in engineering budget?
Ø Which discipline is economical in cost terms?
Ø How accurate was the estimate, esp. for bulk quantities, which vary a lot from project to project and are one of the main reasons of cost overruns.
Ø What value additions Engineering has done in terms of reducing the project cost through Value Engineering / Total Installed Cost / Constructability reviews.
While formulating the parameters to measure the above mentioned variables, the following two parameters were identified –
Ø Cost of Engineering
Ø Quantities Released by Engineering for Construction
Before going into details, one need to understand fllowing basic definitions used to define these parameters.
4-1. THE FUNDAMENTALS
Current Budget – This is the ‘as sold’ budget, i.e., budget approved & agreed with the client after necessary adjustments made. All later scope changes agreed with client are added to this.
Current Forecast – This is the best estimate number (for cost, quantity or schedule) as of status date. This takes care of all trends till date. Trends are deviations of Jobhours, cost or quantity from the approved scope of work.
Actual Cost Earned – The cost earned or charged from the client for the work completed. Thus Cost earned = Jobhours earned x average Est. unit rate + Other direct costs (like, Software, telephone, etc. charged to the client).
Actual Cost Expended – This is the actuial cost expended , i.e., paid to the empoyees towards accomplishing the jobs. This is recorded from the employees’ payment record by the Finance department. The other direct costs (Software, facility, infrastructure,travel, etc.) incurred for accomplishing the job are added to get the total expended cost.
Grade Mix – Grade is used to rate employees’ seniority. Generally, higher the grade, costlier the employee is. In any team, employees at all levels are required. So, a suitable mix of higher & lower grade people should be formed for a team to be efficient as well as economical. Thgis is called as good Grade Mix.
4-2. COST PERFORMANCE
Cost performance is defined as ratio of Actual Cost Expended to the Cost Earned.
Cost Performance = Actual Cost Expended / Budget Cost Earned
Thus, when CP >1, project is working Un-economically and consuming more money than earning.
When CP<1, Project is Economical and saving money.
When CP=1, No savings, earnings are being met for the cost of doing work.
The Cost Performance indicates the followings-
i) How the project is spending with respect to earnings.
ii) How realistically the budget was established.
iii) Which are the Costly / Un-economical disciplines
iv) How good Grade-Mix has been formed.
v) Where are the areas of improvements
Requirements:
The main pre-requisites for measuring the Cost Performance are listed below-
i) Credible charge rates for calculating the actual earnings.
ii) Established mechanism to capture the actual expended cost on the employees.
iii) User-friendly spreadsheet / software to calculate the actual earned and expended values.
iv) Timely availability of cost data (at regular intervals).
Advantages:
Regular measurement and analysis has following advantages to a project -
i) General spending trend is readily known.
ii) The cost figures are readily known which is the ultimate to a contractor.
iii) The un-economical disciplines are immediately identified.
iv) Timely corrective actions can be taken to avoid cost overrun in Engineering budget.
vi) The project Engineering team on further projects can be suitably formed to be Economical.
vii) Total cost being tracked, effective utilisation of softwares& other facilities is also monitored and corrective actions taken.
4-3. QUANTITY PERFORMANCE
This is used to measure performance of bulk quantities. Quantity Perfrmance is defined as ratio of Current Forecast to The Current Budget of a Commodity. Total Quantity Performance (TQP) is calculated after normalising the quantities with their costs (using unit rates).
Quantity Performance = Current Forecast Quantity/ Current Budget Quantity
While calculating the single number for the project, ie Total Quantity Performance, the Current Forecast and Current Budget quantities are multiplied by the unit rate (in estimate) to get the cost. All Forecast costs are added. Similarily all Budget costs are added. Then the formula mentioned here is used –
Toital Quantity Performance = Sum of (Current Budget QuantityxUnit Rate)/Sum of (Current Budget QuantityxUnit Rate)
Thus, when QP >1, The bulk quantities are overrunning. More money is likely to be spent on the increased quantities.
When QP<1, Good design by Engineering. Good savings expected.
When QP=1, No savings, Quantities designed are “as sold”.
This parameter is probably the most important one for an EPC contractor and alarms
of the followings –
Ø How accurate the estimate of bulk quantities was made
Ø How effective the Value Engineering & Constructability program is
Ø Which discipline is saving the most (by reducing the bulk quantities)
Ø Procurement & Construction resource plans, based on the final quantities
Ø Final Procurement and Construction cost
Requirements:
The main pre-requisites for measuring the Quantity Performance are listed below-
i) Estimated Quantities and unit rates (agreed with client) are available.
ii) Final bulk quantities approved by the owner.
iii) A credible procedure to forecast the bulk quantities at regular interval (say, monthly) with back up data.
iv) Buy-in of forecasted quantities from Procurement and Construction.
Advantages:
Regular measurement and analysis has following advantages to a project -
i) Potential variation in quantities is known.
ii) Savings / Overruns due to quantity variations is readily known to the contractor.
iii) Timely corrective actions are possible to attempt.
iv) Engineering Disciplines have clear objective for reducing quantities as it reflects in their performance sheet.
v) Based on the feedback, Estimating able to update their databank for bulks.
5.0 THE DASHBOARD METRICS
To integrate the Conventional and Advanced measures into a single number, the weightages to individual parameters were finalised in such a way that there the Conventional and Advanced measures are equally weighing 50% each. This has further made the approach a comprehensive and balanced one.
Out of the two conventional parameters, schedule is considered to be more important as it can result to huge losses/ gains by affecting the further phases (Procurement/Construction) of the project. So, Schedule Performance is allocated 40% weghtage and Jobhour Poerformance 10%.
Similarly, out of the two advanced parameters, Cost Performance is relatively of internal importance to Engineering, so given 10% weightage while Quantity Performance having potential to impact Procurement / Construction cost was allocated higher weigtage of 40%.
Schedule Performance = 40% Jobhour Performance = 10%
Cost Performance = 10% Quantity Performance = 40%
Based on above mentioned weightages, a metrics is developed and named as Dashboard Metrics. The four measures are multiplied by their weightages and integrated to a single number, called Dashboard Performance. As the name suggests, this shows all performance parameters of Engineering at one place as well as single performance number weighted by the individual parameters. By having a look on Dasboard, a Project Engineer / Project Manager can readily know the performance of his project team and areas needing improvement.
Thus a metrics was developed encompassing all the four parametrs and presented with weightages in a manner shown ahead-
.
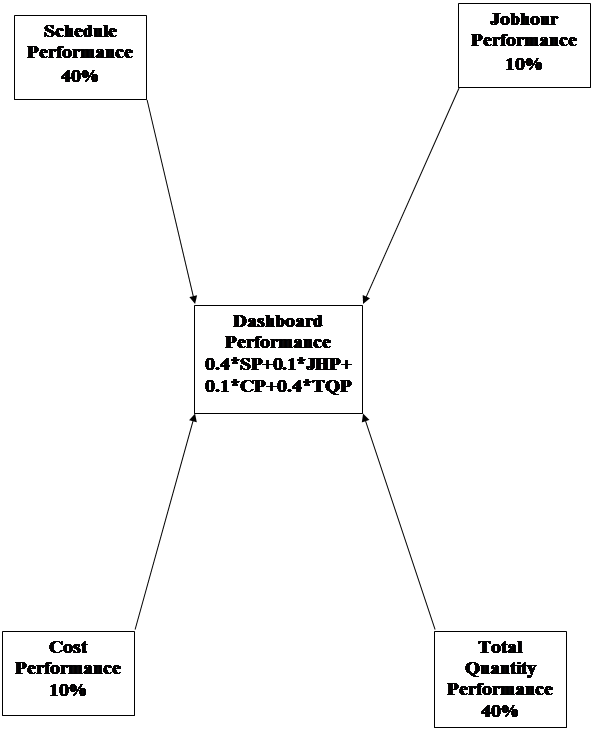
Figure 5-1 : Pictorial Presentation of Dashboard Performance
TABLE – 5-1 : Dashboard Metrics – Analysis of Major Results
|
Sl. No.
|
Dashboard Perf.
|
Schedule Perf.
|
Jobhour Perf.
|
Cost Perf.
|
Quantity Perf.
|
Inference
|
|
1.
|
1
|
1
|
1
|
1
|
1
|
Everything is as Planned
|
|
2.
|
>1
|
>1
|
>1
|
>1
|
>1
|
Nothing is as planned. Major corrective actions required
|
|
3.
|
>1
|
>1
|
<1
|
<1
|
<1
|
Major Delay in Schedule- Most Likley Critical Path shifted (Check!)
|
|
4.
|
>1
|
>1
|
>1
|
<1
|
<1
|
Engineers are wasting time in waiting for info. / Re-work, etc. Need to be attended.
|
|
5.
|
>1
|
>1
|
>1
|
>1
|
<1
|
Eventhough, higher grade (costly ) people are deployed on the project, problems identified in Sl.#4 are existing.
|
|
6.
|
>1
|
<1
|
>1
|
<1
|
<1
|
Lot of re-work occuring. Engineers wasting their time. Efficiency/ Motivation need to be addressed.
|
|
7.
|
>1
|
<1
|
<1
|
>1
|
<1
|
Higher grade people with un-econo,ical software tools are deployed. Grade-Mix to be corrected.
|
|
8.
|
>1
|
<1
|
<1
|
<1
|
>1
|
Quantities bursting. Poor estimate with not so good design work. Lesson must be learned & feedback given to estimating.
|
|
9.
|
<1
|
>1
|
>1
|
<1
|
>1
|
Comparatively inexperienced personnel working on the project which is heading towards a mess. More experienced engineers are immediately required in the Engineering team.
|
|
10.
|
<1
|
<1
|
<1
|
<1
|
<1
|
Everything is going excellent. Good estimate was done and equally good Engineering team is formed. Grade Mix, Co-ordination with vendor and Motivation levels are good.
|
6.0 CASE STUDY
For more clarity on the topic, a case study is being presented as follows –
Part A – Before Implementing the Dashboard :
The Table 6-1 and Figure 6-1 represent the Dashboard metrics data and Dashboard Performance at a glance for a project at around 25% Engineering completion. As can be seen from the Dashboard –
Schedule Performance (SP=1.06) – Progress was lagging behind, however, critical path activities being on schedule, no attention was being paid on this lag. Lot of effort was being put only on critical activities. Control System and Electricsal disciplines were having major problems.
Jobhour Performance being 1.02 - Some re-work was occuring. Enginners were waiting for the inputs from vnedors & not able to utilise their time effectively. Some of them were also not aware of budgets. Plant Design discipline was doing lots of re-work, needed immediate attention.
Cost Performance (1.00) – Cost was just being managed. There was a fairly good grade-mix and infrastructure and facilities being utilised judiciously. Expends of few of the disciplines needed a check. So, there was scope to reduce the cost.
Quantity Performance (1.02) - The engineers were having no aims to design efficiently. Civil and Under Ground conduit designs were in advanced stages and were forecasted for the excess. This would have been a big hit to the project. Design reviews were not very effective.
TABLE – 6-1 : Input Table for Calculating the Dashboard Performance of a project (Before implementing the Dashboard Metrics)
|
Input Sheet
|
|
|
|
|
|
|
|
|
|
Schedule Performance (SP)
|
|
Jobhour Performance (JHP)
|
|
|
Obtain Input Information from EPPR
|
|
|
|
|
|
|
|
|
|
|
|
|
|
|
|
|
|
Hours Scheduled to be earned
|
|
|
Actual Hours Expended
|
|
|
|
Budget Hours Earned
|
|
|
Budget Hours Earned
|
|
|
|
|
|
|
Scheduled Earned
|
Actual Earned
|
Schedule Performance
|
|
|
Actual Hours Expended
|
Budget Actual Earned
|
Jobhour Performance
|
|
|
Architectural
|
590
|
585
|
1.01
|
|
Architectural
|
590
|
585
|
1.01
|
|
|
Civil
|
6,550
|
6,400
|
1.02
|
|
Civil
|
6,520
|
6,400
|
1.02
|
|
|
Control Systems
|
2,400
|
2,120
|
1.13
|
|
Control Systems
|
2,190
|
2,120
|
1.03
|
|
|
Electrical
|
6,200
|
5,602
|
1.11
|
|
Electrical
|
5,685
|
5,602
|
1.01
|
|
|
Mechanical
|
8,650
|
8,420
|
1.03
|
|
Mechanical
|
8,520
|
8,420
|
1.01
|
|
|
Plant Design
|
10,200
|
9,500
|
1.07
|
|
Plant Design
|
9,850
|
9,500
|
1.04
|
|
|
Other Engineering
|
1,220
|
1,224
|
1.00
|
|
Other Engineering
|
1,220
|
1,224
|
1.00
|
|
|
Switchyard
|
650
|
625
|
1.04
|
|
Switchyard
|
640
|
625
|
1.02
|
|
|
|
|
|
|
|
|
|
|
|
|
|
|
|
|
|
|
|
|
|
|
|
|
OVERALL
|
36,460
|
34,476
|
1.06
|
Total SP
|
OVERALL
|
35,215
|
34,476
|
1.02
|
Total JHP
|
|
|
|
|
|
|
|
|
|
|
|
|
Total Quantity Performance (TQP)
|
|
|
|
|
|
|
|
Current Forecast Quantities
|
|
|
|
|
|
|
|
|
Current Budget Quantities
|
|
|
|
|
|
|
|
|
|
|
|
|
|
|
|
|
|
|
|
|
Current Forecast Quantities
|
Current Budget Quantities
|
Quantity Performance
|
|
|
Unit Rates
|
Est. Qty (As sold)
|
|
|
|
Concrete
|
10,000
|
9,599
|
1.04
|
|
|
$ 428.5
|
9599
|
|
|
|
Steel
|
300
|
300
|
1.00
|
|
|
$ 1,776.2
|
300
|
|
|
|
LB A/G Pipe
|
2,354
|
2,354
|
1.00
|
|
|
$ 454.8
|
2354
|
|
|
|
LB Pipe Hanger
|
540
|
540
|
1.00
|
|
|
$ 476.7
|
540
|
|
|
|
SB A/G Pipe
|
7,004
|
7,004
|
1.00
|
|
|
$ 142.5
|
7004
|
|
|
|
LB U/G Pipe
|
7,072
|
7,072
|
1.00
|
|
|
$ 229.6
|
7072
|
|
|
|
Cable
|
171,085
|
171,085
|
1.00
|
|
|
$ 7.3
|
171085
|
|
|
|
Tray
|
3,941
|
3,941
|
1.00
|
|
|
$ 148.0
|
3941
|
|
|
|
Terminations
|
38,339
|
38,339
|
1.00
|
|
|
$ 20.2
|
38339
|
|
|
|
A/G Conduit
|
2,100
|
2,100
|
1.00
|
|
|
$ 67.6
|
2100
|
|
|
|
U/G Conduit
|
2,200
|
1,708
|
1.29
|
|
|
$ 90
|
1708
|
|
|
|
|
|
|
|
|
|
|
|
|
|
|
|
11,719,068
|
11,502,869
|
1.02
|
Total QP
|
|
|
|
|
|
|
|
|
|
|
|
|
|
|
|
|
Cost Performance (CP)
|
|
|
|
|
|
|
|
|
Actual Cost Expended
|
|
|
|
|
|
|
|
|
Budget Cost Earned
|
|
|
|
|
|
|
|
|
|
|
|
|
|
|
|
|
|
|
|
|
|
Actual Cost to-Date
|
Actual Budget Earned Cost to-Date
|
A/S (B)
|
|
|
|
|
|
|
|
Architectural
|
8,850
|
8,800
|
1.01
|
|
|
|
|
|
|
|
Civil
|
97,800
|
97,850
|
1.00
|
|
|
|
|
|
|
|
Control Systems
|
32,850
|
32,500
|
1.01
|
|
|
|
|
|
|
|
Electrical
|
85,275
|
85,100
|
1.00
|
|
|
|
|
|
|
|
Mechanical
|
127,800
|
127,500
|
1.00
|
|
|
|
|
|
|
|
Plant Design
|
147,750
|
146,500
|
1.01
|
|
|
|
|
|
|
|
Other Engineering
|
18,300
|
18,800
|
0.97
|
|
|
|
|
|
|
|
Switchyard
|
9,600
|
9,500
|
1.01
|
|
|
|
|
|
|
|
|
|
|
|
|
|
|
|
|
|
|
|
528,225
|
526,550
|
1.00
|
Total CP
|
|
|
|
|
Figure 6-1 : Pictorial Presentation of Dashboard Performance on a Project (Before Implementing the Dashboard)
|
ENGINEERING DASHBOARD METRICS (BEFORE IMPLEMENTING THE DASHBOARD)
|
|
XYZ Project
|
|
Job No. - xxxxx
|
|
|
|
|
|
|
|
|
|
|
|
|
Hours Scheduled to be earned(BCWS)
|
|
|
|
|
|
Budget Hours Earned (BCWP)
|
|
|
Actual Hours Expended (ACWP)
|
|
|
|
|
|
|
|
Budget Hours Earned (BCWP)
|
|
Schedule Performance
|
|
|
|
|
Jobhour Performance
|
|
|
|
|
|
|
|
|
|
|
Architectural
|
1.01
|
|
|
|
|
Architectural
|
1.01
|
|
Civil
|
1.02
|
|
|
|
|
Civil
|
1.02
|
|
Control Systems
|
1.13
|
|
|
|
10%
|
Control Systems
|
1.03
|
|
Electrical
|
1.11
|

|
|

|
|
Electrical
|
1.01
|
|
Mechanical
|
1.03
|
|
|
|
|
Mechanical
|
1.01
|
|
Plant Design
|
1.07
|
|
|
|
|
Plant Design
|
1.04
|
|
Other Engineering
|
1.00
|
|
|
|
|
Other Engineering
|
1.00
|
|
Switchyard
|
1.04
|
|
|
|
|
Switchyard
|
1.02
|
|
|
|
|
|
|
|
|
|
|
|
|
|
|
|
|
|
|
|
OVERALL
|
1.06
|
|
|
|
|
OVERALL
|
1.02
|
|
|
|
|
|
|
|
|
|
|
|
|
|
OVERALL PERFORMANCE
|
|
|
|
|
|
|
|
|
|
|
|
|
|
Actual Cost Expended
|
1.03
|
|
|
Current Forecast Quantities
|
|

|
|

|
Current Budget Quantities
|
|
Cost Performance
|
|
|
Total Quantity
|
|
|
|
|
|
|
Performance
|
|
|
Architectural
|
1.01
|
|
|
|
Total
|
|
Civil
|
1.00
|
|
|
Concrete
|
1.04
|
|
Control Systems
|
1.01
|
10%
|
|
|
40%
|
Steel
|
1.00
|
|
Electrical
|
1.00
|
|
|
|
|
LB A/G Pipe
|
1.00
|
|
Mechanical
|
1.00
|
|
|
|
|
LB Pipe Hanger
|
1.00
|
|
Plant Design
|
1.01
|
|
|
|
|
SB A/G Pipe
|
1.00
|
|
Other Engineering
|
0.97
|
|
|
|
|
U/G Pipe
|
1.00
|
|
Switchyard
|
1.01
|
|
|
|
|
Cable
|
1.00
|
|
|
|
|
|
|
|
Tray
|
1.00
|
|
|
|
|
|
|
|
Terminations
|
1.00
|
|
OVERALL
|
1.00
|
|
|
|
|
A/G Conduit
|
1.00
|
|
|
|
|
|
|
|
U/G Conduit
|
1.29
|
|
|
|
|
|
|
|
|
|
|
|
|
|
|
|
|
OVERALL TQP
|
1.02
|
TABLE – 6-2 : Input Table for Calculating the Dashboard Performance of a project (After implementing the Dashboard Metrics)
|
Input Sheet (After Implementing Dashboard Metrics)
|
|
|
|
|
|
Schedule Performance (SP)
|
|
Jobhour Performance (JHP)
|
|
|
Obtain Input Information from EPPR
|
|
|
|
|
|
|
|
|
|
|
|
|
|
|
|
|
|
Hours Scheduled to be earned
|
|
|
Actual Hours Expended
|
|
|
|
Budget Hours Earned
|
|
|
Budget Hours Earned
|
|
|
|
|
|
|
Scheduled Earned
|
Actual Earned
|
Schedule Performance
|
|
|
Actual Hours Expended
|
Budget Actual Earned
|
Jobhour Performance
|
|
|
Architectural
|
1,127
|
1,203
|
0.94
|
|
Architectural
|
1,204
|
1,203
|
1.00
|
|
|
Civil
|
14,307
|
14,500
|
0.99
|
|
Civil
|
13,400
|
14,500
|
0.92
|
|
|
Control Systems
|
5,875
|
5,948
|
0.99
|
|
Control Systems
|
4,792
|
5,948
|
0.81
|
|
|
Electrical
|
13,319
|
14,200
|
0.94
|
|
Electrical
|
12,200
|
14,200
|
0.86
|
|
|
Mechanical
|
14,777
|
14,801
|
1.00
|
|
Mechanical
|
14,250
|
14,801
|
0.96
|
|
|
Plant Design
|
15,458
|
15,645
|
0.99
|
|
Plant Design
|
13,465
|
15,645
|
0.86
|
|
|
Other Engineering
|
2,404
|
2,425
|
0.99
|
|
Other Engineering
|
2,124
|
2,425
|
0.88
|
|
|
Switchyard
|
2,700
|
2,750
|
0.98
|
|
Switchyard
|
2,728
|
2,750
|
0.99
|
|
|
|
|
|
|
|
|
|
|
|
|
|
|
|
|
|
|
|
|
|
|
|
|
OVERALL
|
69,967
|
71,472
|
0.98
|
Total SP
|
OVERALL
|
64,163
|
71,472
|
0.90
|
Total JHP
|
|
|
|
|
|
|
|
|
|
|
|
|
Total Quantity Performance (TQP)
|
|
|
|
|
|
|
|
Current Forecast Quantities
|
|
|
|
|
|
|
|
|
Current Budget Quantities
|
|
|
|
|
|
|
|
|
|
Current Forecast Quantities
|
Current Budget Quantities
|
Quantity Performance
|
|
|
Unit Rates
|
Est. Qty (As sold)
|
|
|
|
Concrete
|
6,881
|
9,599
|
0.72
|
|
|
$ 428.5
|
9599
|
|
|
|
Steel
|
300
|
300
|
1.00
|
|
|
$ 1,776.2
|
300
|
|
|
|
LB A/G Pipe
|
2,405
|
2,354
|
1.02
|
|
|
$ 454.8
|
2354
|
|
|
|
LB Pipe Hanger
|
441
|
540
|
0.82
|
|
|
$ 476.7
|
540
|
|
|
|
SB A/G Pipe
|
6,332
|
7,004
|
0.90
|
|
|
$ 142.5
|
7004
|
|
|
|
LB U/G Pipe
|
6,249
|
7,072
|
0.88
|
|
|
$ 229.6
|
7072
|
|
|
|
Cable
|
129,931
|
171,085
|
0.76
|
|
|
$ 7.3
|
171085
|
|
|
|
Tray
|
3,490
|
3,941
|
0.89
|
|
|
$ 148.0
|
3941
|
|
|
|
Terminations
|
35,937
|
38,339
|
0.94
|
|
|
$ 20.2
|
38339
|
|
|
|
A/G Conduit
|
2,020
|
2,100
|
0.96
|
|
|
$ 67.6
|
2100
|
|
|
|
U/G Conduit
|
5,530
|
1,708
|
3.24
|
|
|
$ 90
|
1708
|
|
|
|
|
|
|
|
|
|
|
|
|
|
|
|
9,951,968
|
11,502,869
|
0.87
|
Total QP
|
|
|
|
|
|
|
|
|
|
|
|
|
|
|
|
|
Cost Performance (CP)
|
|
|
|
|
|
|
|
|
Actual Cost Expended
|
|
|
|
|
|
|
|
|
Budget Cost Earned
|
|
|
|
|
|
|
|
|
|
|
|
|
|
|
|
|
|
|
|
|
Obtain from Cost Engineer
|
|
|
|
|
|
|
|
|
|
Actual Cost to-Date
|
Actual Budget Earned Cost to-Date
|
A/S (B)
|
|
|
|
|
|
|
|
Architectural
|
18,060
|
18,832
|
0.96
|
|
|
|
|
|
|
|
Civil
|
201,000
|
202,100
|
0.99
|
|
|
|
|
|
|
|
Control Systems
|
71,880
|
74,200
|
0.97
|
|
|
|
|
|
|
|
Electrical
|
183,000
|
185,200
|
0.99
|
|
|
|
|
|
|
|
Mechanical
|
213,750
|
214,500
|
1.00
|
|
|
|
|
|
|
|
Plant Design
|
201,975
|
202,500
|
1.00
|
|
|
|
|
|
|
|
Other Engineering
|
31,860
|
32,200
|
0.99
|
|
|
|
|
|
|
|
Switchyard
|
40,920
|
42,900
|
0.95
|
|
|
|
|
|
|
|
|
|
|
|
|
|
|
|
|
|
|
|
962,445
|
972,432
|
0.99
|
Total CP
|
|
|
|
|
Figure 6-2 : Dashboard Performance of a Project (After Implementing the Dashboard)
|
ENGINEERING DASHBOARD METRICS (AFTER IMPLEMENTING THE DASHBOARD)
|
|
XYZ Project
|
|
Job No. - xxxxx
|
|
|
|
|
|
|
|
|
|
|
|
|
Hours Scheduled to be earned(BCWS)
|
|
|
|
|
|
Budget Hours Earned (BCWP)
|
|
|
Actual Hours Expended (ACWP)
|
|
|
|
|
|
|
|
Budget Hours Earned (BCWP)
|
|
Schedule Performance
|
|
|
|
|
Jobhour Performance
|
|
|
|
|
|
|
|
|
|
|
Architectural
|
0.94
|
|
|
|
|
Architectural
|
1.00
|
|
Civil
|
0.99
|
|
|
|
|
Civil
|
0.92
|
|
Control Systems
|
0.99
|
40%
|
|
|
10%
|
Control Systems
|
0.81
|
|
Electrical
|
0.94
|

|
|

|
|
Electrical
|
0.86
|
|
Mechanical
|
1.00
|
|
|
|
|
Mechanical
|
0.96
|
|
Plant Design
|
0.99
|
|
|
|
|
Plant Design
|
0.86
|
|
Other Engineering
|
0.99
|
|
|
|
|
Other Engineering
|
0.88
|
|
Switchyard
|
0.98
|
|
|
|
|
Switchyard
|
0.99
|
|
|
|
|
|
|
|
|
|
|
|
|
|
|
|
|
|
|
|
OVERALL
|
0.98
|
|
|
|
|
OVERALL
|
0.90
|
|
|
|
|
|
|
|
|
|
|
|
|
|
OVERALL PERFORMANCE
|
|
|
|
|
|
|
|
|
|
|
|
|
|
Actual Cost Expended
|
0.93
|
|
|
Current Forecast Quantities
|
|

|
|

|
|
Current Budget Quantities
|
|
Cost Performance
|
|
|
|
|
Total Quantity
|
|
|
|
|
|
|
|
|
Performance
|
|
|
Architectural
|
0.96
|
|
|
|
|
|
Total
|
|
Civil
|
0.99
|
|
|
|
|
Concrete
|
0.72
|
|
Control Systems
|
0.97
|
10%
|
|
|
40%
|
Steel
|
1.00
|
|
Electrical
|
0.99
|
|
|
|
|
LB A/G Pipe
|
1.02
|
|
Mechanical
|
1.00
|
|
|
|
|
LB Pipe Hanger
|
0.82
|
|
Plant Design
|
1.00
|
|
|
|
|
SB A/G Pipe
|
0.90
|
|
Other Engineering
|
0.99
|
|
|
|
|
U/G Pipe
|
0.88
|
|
Switchyard
|
0.95
|
|
|
|
|
Cable
|
0.76
|
|
|
|
|
|
|
|
Tray
|
0.89
|
|
|
|
|
|
|
|
Terminations
|
0.94
|
|
OVERALL
|
0.99
|
|
|
|
|
A/G Conduit
|
0.96
|
|
|
|
|
|
|
|
U/G Conduit
|
3.24
|
|
|
|
|
|
|
|
|
|
|
|
|
|
|
|
|
OVERALL TQP
|
0.87
|
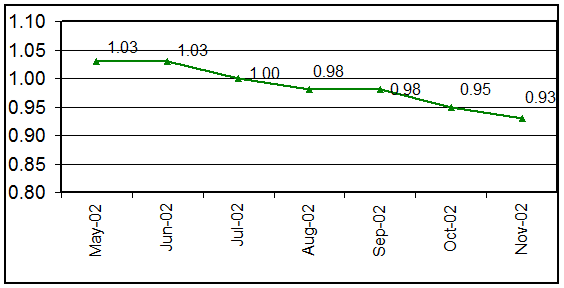
Figure 6-3 : Graph for Dashboard Performance Trend on a Project (After Implementing the Dashboard)
Part B – After Implementing the Dashboard :
A comprehensive analysis was done for the performances >1.0 (as shown in Part-A) and various corrective actions taken. The actions and initiatives were implemented and recommended to other projects as well. The signs of improvements were almost immediate and continuous. Every month was a better month. The situation has been shown in the graph above (Figure 6-3). And after around 5 months, the status was as shown in Table 6-2 and Figure 6-2 which represent the Dashboard metrics data and Dashboard Performance for the same project at around 70% Engineering completion.
It is very much clear that there was a sunstantial improvement in the performance of Engineering. It was, however, not posssible by just measuring the performance. Measuring is the easiest part. Analyzing the results and recommending the corrective actions is rather difficult job and needs a lot of experience and knowledge. The improved performance is the result of coprrective actions based on the measurements.
Some of the corrective actions taken on improving various performance factors and effects observed, author thinks worth mentioning for the reference of the readers –
1. Schedule Performance :
A The team needed to understand the schedule – Run through sessions were organized for all the disciplines and schedules and their importance was explained. It was stressed that the each member of the team is the owner of the schedule. Project Controls only facilitates the implementation.
A The Inputs were the main Bottlenecks – The inputs from vendor or owner were found to be the single most affecting reason for delays in the Engineering deliverables. So, a person was stationed at the owner’s office for co-ordinating the inputs. Vendor shop visit plans were prepared for the project and implemented effectively. Wherever necessary, teleconferences were organized with the vendor with follow up calls. These initiatives resulted in significant improvement in schedule performance of the projects.
A Procurement was able to place their orders in timely manner. In fact, they got sufficient time to negotiate and make huge savings in some of the major equipment.
A Construction almost never waited for drawings and Mechanical completions were being achieved well ahead of the schedules.
A It started with 1.06 and the current performance is at 0.98.
2. Jobhour Performance :
A The budgets were communicated to the Engineers – The budgets for individual activities were examined in each project and feedback to estimating be given to accordingly update their databank so that budgets allocated are realistic.
A The areas of re-work were identified and analyzed. Some of the processes needing standardization were standardized. Vendor revising their inputs at later stages were identified and corrective actions implemented.
A Engineering re-work directly means re-work to Procurement / Construction. Thus by minimizing the re-work to engineering, re-work to other phases was also minimized. The Plant Design discipline was most benefited by this.
A The costs of expensive softwares were minimized because of fewer hours used on the softwares.
A The saved Jobhours are being utilized on Value Engineering and Constructability reviews resulting huge savings to the project.
A This has resulted in substantial improvement in the dedication and performance of the Engineers. Previously struggling for 1.0, the current level hovers around 0.95 and is 0.90 as of end Nov-02.
3. Cost Performance :
A The Project Engineer reviews the discipline grade-mixes before finalizing the staffing plan.
A The corrective actions were implemented for un-economical disciplines, i.e., unnecessary higher grade people were demobilised earlier.
A Some of the disciplines were having right grade-mix, still not cost efficient. It was found that they are NOT using the costly Engineering software tools efficiently. So, corrective actions were taken.
A The Project Engineering teams are now formed after thorough grade-mix analysis.
A The performance which was being managed at 1.0 is now at 0.99.
3. Quantity Performance :
A Engineers have started to question themselves before finalising the design –“Is this the most economical (and of course safe) way to do the job”?
A Engineering Disciplines have clear objective for reducing quantities as it reflects in their performance sheet.
A Based on the feedback, Estimating has updated their databank for bulks.
A Costly commodities are being given more effort to reduce the quantities. The commodities costing relatively less, are just examined for any possibile savings.
A Focus on efficient design has resulted spectacular gains to the project as presented in the dashboard – a performance of 0.87 against the initial one of 1.02.
7.0 CONCLUSIONS
Managing a project may sound easy but managing a project efficiently does not sound that easy. It needs a focussed and motivated team in all phases of a project. Engineering being the first one to kickstart an EPC project, most of the part of a project can be controlled by just efficient design which is quite possible by a good performing Engineering team. The author believes that the performance of anything can be bettered if the baseline and targets are known , i.e., if it is rightly monitored . And the introduced concept of Dashboard ensures this for Engineering. As told by the author to Project Engineers -“The Dashboard helps track your hits and misses”.
It is imperative to mention that by mere measuring the Dashboard performance, nothing will improve, unless the results are analysed and corrective actions taken in timely manner. As illustrated in section 6 of this paper, by analysing and taking proper and timely corrective actions, improvements ranging from 1% (Cost Performance) to approx. 15% (Quantity Performance) were achieved. Also, a significant improvement in overall Dashboard performance was achieved, which is approx. 10% better (The Dashboard performance recorded in June-02 = 1.03 and in Nov-02=0.93) with almost same resources. The improved performances ultimately result to cost savings which may range to millions of dollors depending upon the type of saving. This also increases overall control on the project which ensures ‘no surprises’ with minimum risks and maximum gains.
The author himself has seen many projects benefiting after implementing the Dashboard Metrics and suggests the readers to use it as it is for Engineering or customize it based on your project objectives and monitoring area and then use for the optimum results. Also, the same concept can be extended to monitor other phases, like Procurement and Construction, of a project . The suitable parameters can be identified and subsituted in the Dashboard to achieve the desired objectives.
8.0 BIBLIOGRAPHY
¯ Unpublished company handouts for Engineering Performance.
¯ Unpublished company handouts from Project Controls University Classes.
¯ Skills & Knowledge of Cost Engineering – 4th Edition by Dr. Richard E. Larew.
 Australia
 International


 Blogs
Blogs Glossary
 Templates
 Videos
 Paperback Literature


.png?w=1200&h=0&crop=1)
.png)


