Blogs


Welcome to Project Controls Institute, Australia blog.

Selection of thoughts and tips shared by Project Controls community.

test

How does "Resource curve" work in P6?


How does “Resource curve” work?


Let say we have an activity with 100 days duration and 100 labor units. By default it use Linear spread.

It mean, when you reach 5% of duration (5th day in this example) you have 5% of total unit (5 unit in this example). And it spread evenly to that period.

So resource spreadsheet will be like this:

Now if I change to 6 %.

3

It mean, when you reach 5% of duration (5th day in this example) you have 6% of total unit (6 unit in this example). And it spread evenly to that period.

So resource spreadsheet will be like this:

Similarly, when you reach 10% of duration (10th day in this example) you have 5% more of total unit (5 unit in this example). And it spread evenly to that period.

So resource spreadsheet will be like this:

And it follow that regulation until the end of curve.

Now you understand how the resource curve work.

Hopefully it will help you to distribute resource unit as your wish:-)


Tags:
Continue reading
44286 Hits
0 comments

How to backup and restore Primavera P6 Oracle Express (XE) database


Notes:

  • Be sure to remove any < > used in the above examples
  • Backup command example:  exp system/mypassword@XE full=y file=C:\PrimaveraP6\backups\xedump.dmp log=C:\PrimaveraP6\backups\exp_xedump.log
  • If any of the paths contain spaces they should be enclosed in single quotes. EX: log=’C:\My directory that has a space\exp_xedump.log’

How to restore:

From the command prompt (go to ‘Start’ > ‘Run’ > type ‘cmd’ and click ‘OK’) using the format below

imp userid=system/ @xe file= \xedump.dmp commit=y buffer=8000000 fromuser=(admprm$pm,privprm$pm,pubprm$pm,bgjob$pm) touser=(admprm$pm,privprm$pm,pubprm$pm,bgjob$pm) log= \imp_xedump.log


Where:

  • is the password you used when you installed P6 Standalone or Oracle XE manually
  • is the complete path to the folder where the existing database backup dmp file is located and where the log file will be created. (For example: file=C:\PrimaveraP6\backups\xedump.dmp log=C:\PrimaveraP6\backups\xedump_import.log)
    • If any of the paths contain spaces they should be enclosed in single quotes. EX: log=’C:\My directory that has a space\imp_xedump.log’

Note:

When importing using the import ‘touser’ option, the database users specified must already exist in the target database into which you’re importing the data.

To check whether these users exist or not:

  1. Open a new command prompt window (go to ‘Start’ > ‘Run’ > type ‘cmd’ and click ‘OK’)
  2. In the command prompt window, type: “sqlplus system/ @xe”
    where is the password you used when you installed P6 Standalone or Oracle XE manually
  3. At the SQL> prompt, type: “select username from dba_users;”
  4. Check for the P6 schema users in the list of current database users

To create these users if the do not already exist, use the following steps:

  1. Download one of the following scripts:
  2. Review the before_import.sql script and make necessary modifications for your environment (such as tablespace locations)
  3. Open a new command prompt window (go to ‘Start’ > ‘Run’ > type ‘cmd’ and click ‘OK’)
  4. In the command prompt window, type: “sqlplus sys/ @xe as sysdba”
    where is the password you used when you installed P6 Standalone or Oracle XE manually
  5. At the SQL> prompt, type: “@ \”
    where is the complete path to the script and is the name of file.  Example, @C:\temp\before_import_8x.sql
Tags:
Continue reading
44274 Hits
0 comments

The Schedule Quality Index™

With the recent launch of the Fuse Schedule Index Calculator, we often get asked, what is the Schedule Quality Index™ and how is it calculated? 

First and foremost the Schedule Quality Index is a means of assessing how well planned a schedule.  It is a single score that is calculated from nine separate schedule check metrics.  The metrics span multiple key attributes, or building blocks of a schedule that together from the underpinnings of a structurally sound schedule. 

The Schedule Quality Index is made up of the following nine checks (metrics):

Missing Logic

In theory, all activities should have at least one predecessor and one successor associated with them. Failure to do so will impact the quality of results derived from a time analysis as well as a risk analysis. This number should not exceed more than 5%.

Logic Density™

This metric calculates the average number of logic links per activity. An average of less than two indicates that there is logic missing within the schedule. An average greater than four indicates overly complex logic, with a high likelihood of redundant links. Therefore, Logic Density™ should be between two and four.

Critical

While a highly critical schedule is not necessarily a sign of poor scheduling, it can indicate a highly risky schedule. Use this metric as a point of reference.

Hard Constraints

Hard, or two-way, constraints such as ‘Must Start On’ or ‘Must Finish On’ should be avoided. Use of such constraints can lead to inaccurate finish dates and a lack of insight into the impact of schedule changes, risk events, and earlier delays.

Negative Float

Negative float is a result of an artificially accelerated or constrained schedule, and is an indication that a schedule is not possible based on the current completion dates.

Insufficient Detail™

Activities with a high duration relative to the life of the project are an indication of poor schedule definition. Detail should be added to the schedule.

Number of Lags

A lag is a duration applied to a logic link often used to represent non-working time between activities such as concrete curing. Lags tend to hide detail within the schedule and cannot be statused like normal activities; therefore, lags should be converted to actual activities with durations.

Number of Leads

A lead, also known as a negative lag, is often used to adjust the successor start or end date relative to the logic link applied. This is a poor practice as it can result in the successor starting before the start of the predecessor.

Merge Hotspot

A merge hotspot is an indication of how complex the start of an activity is. If the number of links is greater than two, there is a high probability that the activity in question will be delayed due to the cumulative effect of all links having to complete on-time in order for the activity to start on time.

Continue reading
30044 Hits
0 comments

Planning & Scheduling rules/principles

·         Project Plans which optimise expenditure of time, recognise cost implications and reflect the contractual obligations for the design, procurement, construction and commissioning of plant facilities.

·         Regular updates of all project activities and their inter relationships.

·         Early indication of deviations from the approved project programme so that action can be taken to minimise their effect.

It is to be noted that key elements of plans are Scope of work and Method of execution including WBS.   

With regards to Scheduling, it is a determination of timing of events in the Project i.e., When tasks will be performed and its a reflection of plan. Here are main features of scheduling :

·         Provides comparison of actual progress against plan

·         Identify deviations from plan (problem areas)

·         Enables early corrective actions and adjustments to plan

In other words, scheduling is the science of using mathematical calculations and logic to predict when and where work is to be carried out in an efficient and time-effective sequence.

Here are some rules to minimise the chances of your plan to get failed and ensure project completes before or on time.


Ø   Most importantly, Project Planning & Scheduling must involve decisions concerning :

·         the overall strategy of how the work process is to be broken down for control;

·         how the control is to be managed;

·         what methods are to be used for design, procurement & construction;

·         the strategy for subcontracting and procurement;

·         the interface between the various participants;

·         the zones of operation and their interface;

·         maximising efficiency of the project strategy with respect to cost and time;

·         risk and opportunity management.

Ø   In the process of converting the plan into a schedule  the scheduler should determine:

·         the duration of the activities;

·         the party who will perform the activities;

·         the resources to be applied to the activities; and

·         the method of sequencing of one, or more activities in relation to other activities.

Ø   Depending upon the density of the schedule, the purpose for which it is to be used and the information available, an activity duration must be derived from following only. Any assumptions must be documented in case needs to be validated in future.

·         experience

·         industry standards

·         benchmarking

·         comparison with other projects

·         calculation from resources

·         specification.

Ø   The schedule must illustrate a realistic and practical project plan showing how the project is intended to be, in a form that is sufficiently accurate for its identified density.

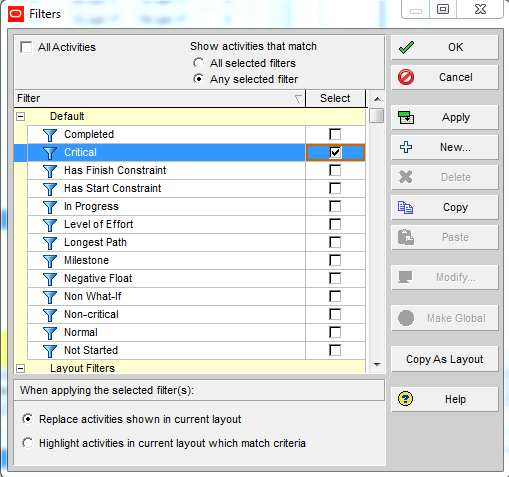
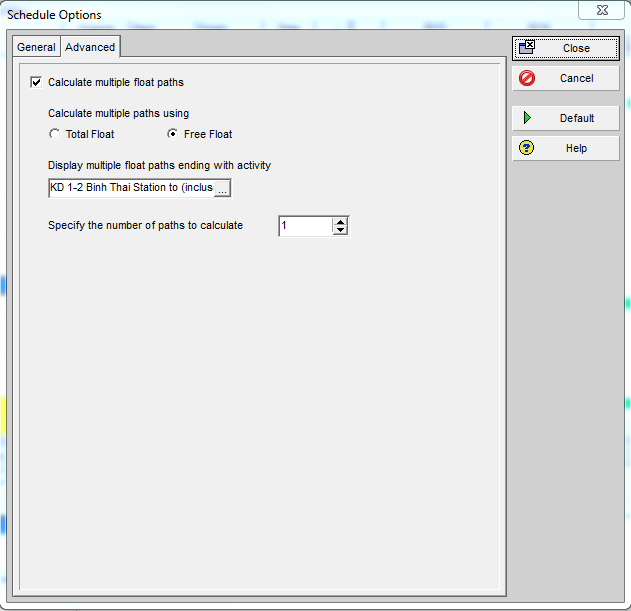
Ø   Schedule must be capable of identifying the following:

·         the longest path to completion;

·         the longest path to intermediate key dates, or sectional completion dates;

·         logic and activities, which are critical from those, which are not critical to one, or more completion dates;

·         total float on each path;

·         free float on each activity, on each path;

Ø   The strategy for schedule review must take account of the development of the schedule as better information becomes available and, as the project proceeds, the increasing density of the schedule as it develops from initiation through the work on site to commissioning the completed project.

Ø   When change is imposed, scheduler must be able to identify it contemporaneously, the effect of delaying and disrupting causal events on the planned sequence and to advise team members on the likely effect of possible recovery strategies.

Ø   Risk is inevitable part of any program however if dealt well, can be brought under control. Contingency period to deal with risks should be designed to be identified separately for both the employers and the contractors risks and for those risks which are related to:

·         an activity, or chain of activities

·         a contractor, subcontractor, supplier, or other resource

·         an access, or egress date, or date of possession, or relinquishment of possession

·         the works, any defined section, and any part of the works.

Ø   For Schedule reporting , it is impracticable to use the whole of the schedule at any one time in its detail. For effective reporting it should be summarised to different degrees of summarisation for differing purposes. Most project scheduling software packages facilitate this hierarchical structuring by virtue of a summarisation, or roll-up facility.

Some basic tips:

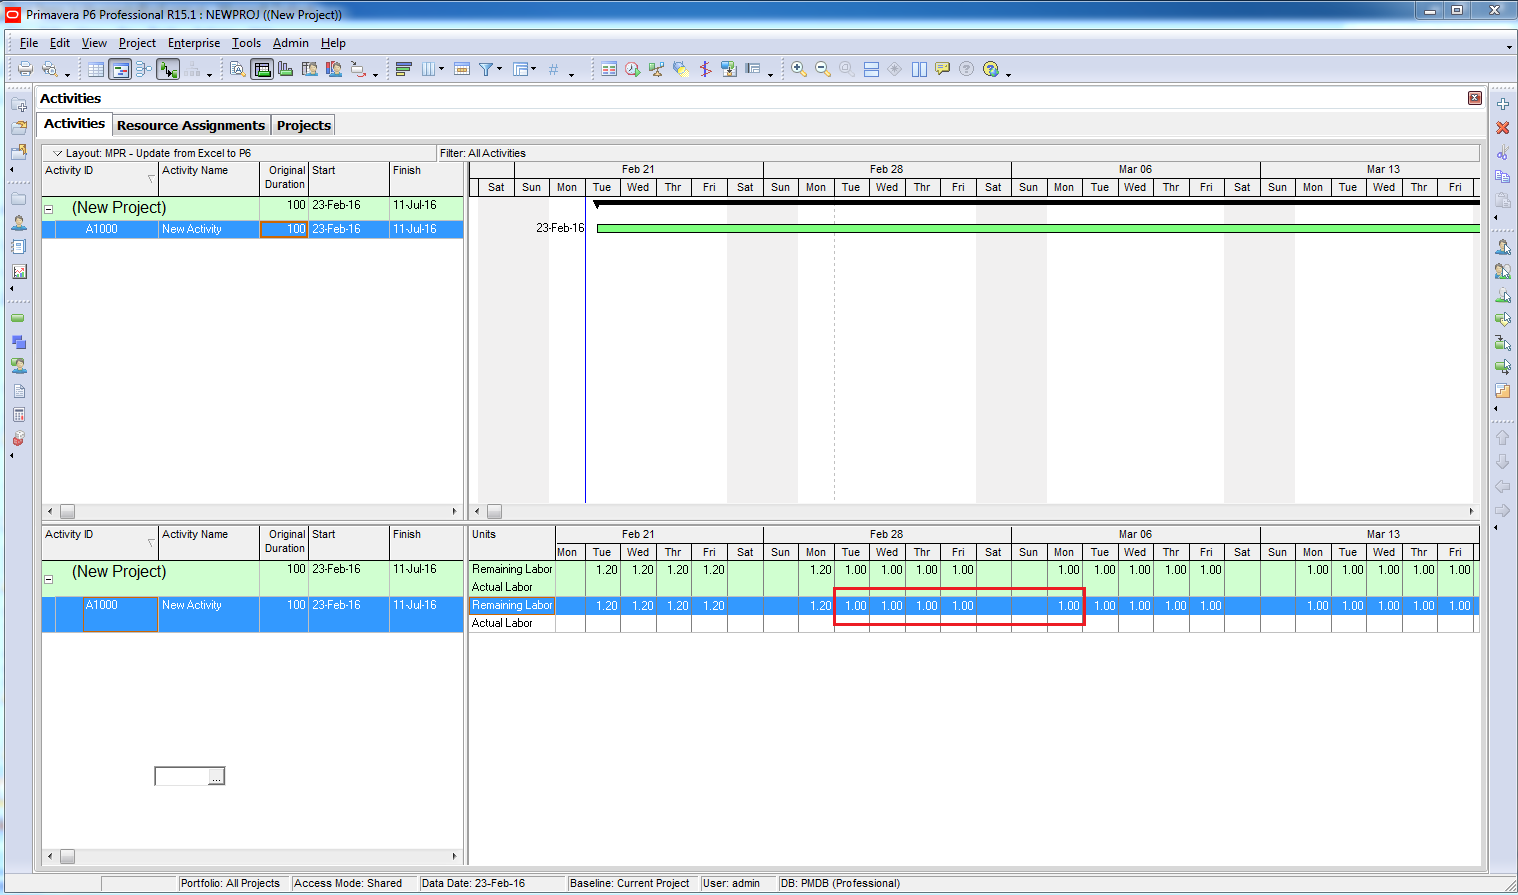
  • Do not use Mandatory Constrained dates. If a constraint has been used, then “Start on or After” can be opted. Keep use constraints as minimal as possible.
  • Adopt Finish to Start logic as much as possible. Avoid SF links completely.
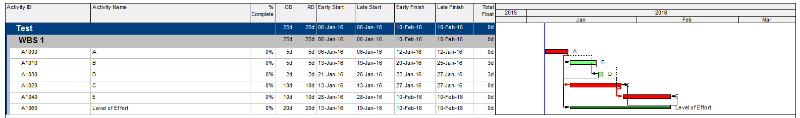
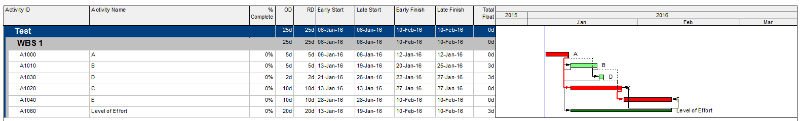
  • No “Dangles” at all in schedule. LOE tasks could be an exception here.
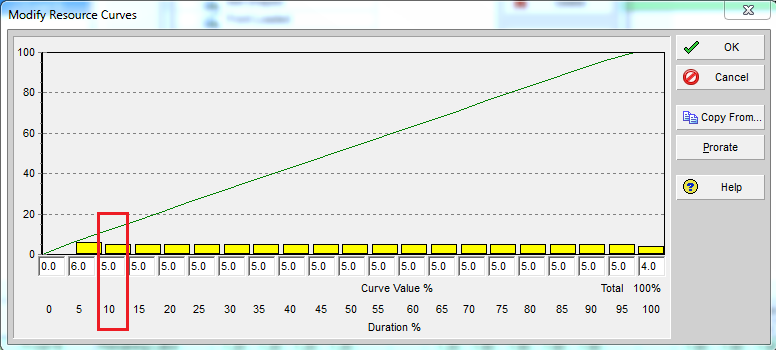
  • Avoid use of lags, especially long duration lags
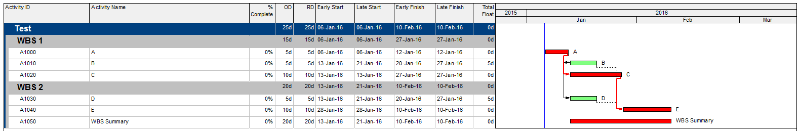
  • Keep Level 3 activities to similar levels of detail whenever possible
  • Roll-ups from Level 3 to Level 2 must be “many to one” with no splitting of level 3 activities into individual level 2’s
  • Status activities only after confirming its reliability & source
  • Make your activity ID’s intelligent to identify where it belongs to.
  • WBS development is must before the creation of schedule
  • Avoid changing RD just to keep the activity out of critical path
  • Identify Key Events and Drop Dead Times before developing the plan
  • Schedules needs not to be way too detailed.
  • Be realistic irrespective of pressure from Client, Project Managers and Engineering/Construction leads.
  • Avoid “tweaking” of the logic to “make it fit.”
  • Activities must be linear and sequential (Finish-to-Start), instead of being overlapped, i.e., successor starts before the predecessor – a version of “fast-tracking” at the molecular level.
  • Planning procedure should encompass familiarisation, outline plan, strategic plan and detailed plan along with planning method statement
  • Do not deceive (to mislead by a false appearance or statement). Don’t mislead the schedule by false appearance
  • Get buy-in from the responsible owners of the plan. In absence of this, plan is no more than a worthless piece of paper.
  • Ensure the calendars are set before developing the plan to includes the holidays and working hours restrictions, if any.
  • Activity codes should identify the various attributes of the schedule as fields, the values of which will facilitate organisational changes, and facilitate filtering of important parts of the schedule.
  • Schedule review must check for buildability, content, integrity, constraints, open end tasks, long lags, negative lags, ladders and critical paths to name a few.

Summary:

Don’t twist the plan, contort the plan, reduce the plan, expand the plan, modify the plan, distort the plan, adjust the plan, change the plan.. Instead, follow the plan..

Continue reading
13912 Hits
0 comments

Does it matter calculating the total float from the start dates or finish dates in P6?


So, does it matter? Or does it give different results?


The Answer to this question is yes, it does matter in two cases.

1 – Using the WBS summary activity

2 – Using the level of effort activity

In order to know the difference, we must know how both type of activities calculate their early and late dates.

The WBS summary:

The late finish date = The latest late finish date of the activities in the WBS group. The early finish date = The latest early finish date of the activities in the WBS group.

The late start = The earliest late start date of the activities in the WBS group. The early start date = The earliest early start date of the activities in the WBS group.

So in the following example:

Figure 2 – WBS summary example

Activity A1050, is a WBS summary activity has early start of activity D and late start of activity E, Early finish of Activity E and late finish of activity E.

So if the total float is calculated based on the finish date, the total float of the WBS summary activity would be zero as shown in the figure 2.

But if the settings are changed to calculate the float based on the start date the float of this activity would be 5 days as shown in the figure below.

Figure 3- WBS summary float calculations based on start dates

The Level of effort activity:

The late finish date = The latest late finish date of the successor activities. The early finish date = The latest early finish date of the successor activities.

The late start = The earliest late start date of the Predecessor activities. The early start date = The earliest early start date of the Predecessor activities.

So in the following example:

Figure 4 – Level of effort example

Activity A1060, is a level of effort activity has early start of activity B and late start of activity B, Early finish of Activity E and late finish of activity E.

So if the total float is calculated based on the finish date, the total float of the level of effort activity would be zero as shown in the figure 4.

But if the settings are changed to calculate the float based on the start date the float of this activity would be 3 days as shown in the figure below.

Figure 5- level of effort float calculations based on start dates

So you have to consider the float calculation method for these types of activities either by:

1- Finish dates
2 – Start dates
3- Minimum of both

Source : https://www.linkedin.com/pulse/does-matter-calculating-total-float-from-start-dates-assem


Tags:
Continue reading
19206 Hits
0 comments

Create critical path for "any activity" in Primavera P6


Create critical path for “any activity”

5

In Primavera when we use the default “Critical” filter, it will show the critical path for the whole project (for the last activity).

1

How about if we want to show critical path for an activity which is somewhere in middle of project, not the last one.

In this case we can use “Multiple float paths” function.

You can go to Tool -> Schedule -> Option -> Advanced tab ->

  • Check “Calculate multiple float paths”
  • Check “Free Float”
  • In “Display multiple float paths ending with activity”, you choose the activity you want the critical path ending with.
  • In “Specify the number of paths to calculate”, I usually choose “1”.
  • Click Close and Run Schedule.

2

Then you go to View -> Group and Sort.

  • Group by “Float Path”

3

You can also create a Filter so that we can hide all unnecessary activity.

4

Then we can have the “small” critical path for the activity we want:-)


Tags:
Continue reading
22963 Hits
0 comments

Categories

Search

Australian Open Learning Pty Ltd t/a Project Controls Institute, Australia | RTO CODE :45806