Blogs


Welcome to Project Controls Institute, Australia blog.

Selection of thoughts and tips shared by Project Controls community.

test

Scheduling and the ‘Progress Override v Retained Logic’ Conundrum

Scheduling and the ‘Progress Override v Retained Logic’ Conundrum

With the growing use of project management software to analyse construction delays, comes the often overlooked question – how does the software really work? This is of course a pretty meaty query and way too big for a single article. But within it are some more manageable ‘bite-sized’ issues. One of these is programme scheduling and how out-of-sequence working is rationalized by the software during the scheduling process. Now whilst some might consider the usefulness of this topic limited to the planners’ amongst you, it is important to recognise its wider implications upon defining and quantifying critical path delays.


So what is ‘programme scheduling’?
 
In a nutshell, scheduling is the process of updating a programme to a certain date during the course of a project (often referred to as the ‘data date’) by incorporating progress information for all activities in the programme up to that point in time. On many projects this is done at least once a month, with the updated programme included in the monthly progress report. The process itself involves adding actual start/finish dates, the percentage complete, and remaining duration of individual activities that have in some way changed over the reporting period. Once this information is added, the programme is scheduled (or rescheduled), calculating new start/finish dates for all activities in the programme according to a bunch of preset logic rules defined by the operator.
 
The average construction programme invariably contains many thousands of these user defined logic rules. These rules transform a static bar chart into a much more useful dynamic model which can be gradually updated with progress and other changes to assist managing the project and tracking delays. These rules include things like:- (a) logic relationships between activities (e.g. task A must be complete before task B can start); (b) different working-day calendars for specific types of tasks; and (c) resource dependent activity durations.
 
In addition, they also include a choice between using the Progress Override or Retained Logic options when dealing with out-of-sequence progress of activities (i.e. when an activity progresses in advance of when it otherwise would have according to the prevailing logic rules). When the Progress Override option is chosen, work is allowed to proceed on the out-of-sequence activity immediately and the logic links from its predecessor activities are overridden. If the Retained Logic option is chosen, these predecessor links are not overridden and remain in force thereby governing when the remainder of the out-of-sequence activity will be carried out.
 
Figure-1 and 2 are included below to help show the difference between these 2 operations.
Figure-1 shows 2 activities, A and B, where activity A was planned to be fully complete before the start of B. This is known as a finish-to-start logic link.
 
Figure-2 then demonstrates how the software deals with the situation where, during the works, activity B starts before A is complete. If the Retained Logic option is used, the remaining duration of activity B is scheduled to occur after A is complete. In contrast if the Progress Override option is chosen, then the finish-to-start logic between activity A and B is ignored or overridden. In this case activity B is allowed to progress notwithstanding that A is not finished.
 
 
The end result is that the Progress Override option leads to an earlier projected finish date for activity B. It also means that activity A is no longer on the critical path at the time of the progress update.
 
The wider implications of this choice will hopefully become clearer after working through an example. Consider a hypothetical reclamation project with a contract duration of 8 months. Upon commencement the Contractor is to carry out preliminary site investigation of the seabed and then prepare a detailed dredging layout plan. Once this is approved by the Engineer, the Contractor is to proceed with dredging, followed by construction of a rock filled seawall. The final stage is to place sand fill behind the seawall up to formation level. The corresponding programme is set out in Figure-3 below.
 
 
Now consider the situation as at the end of Month-2. Say that site investigation and drawing preparation proceeded as-planned. However, whilst generally accepting the submitted dredging layout, the Engineer would not formally approve the drawing until he had ‘checked a few things’. In response the Contractor decided to proceed with dredging and make any minor amendments (if necessary) after final approval was received. By doing this the Contractor was able to progress dredging at the planned rate so that up to the end of Month-2 it was around 30% complete, and there was no actual delay to dredging.
The status at the end of Month-2 can therefore be shown in 2 ways. The first is shown in Figure-4a (using Progress Override) and 2nd in Figure-4b (using Retained Logic).
 
 
The most sensible view of status at the end of Month-2 is clearly that shown in Figure-4a. As soon as dredging commenced it became critical, and the ongoing late ‘formal’ approval of the dredging layout dropped off the critical path. The alternative view, shown in Figure-4b, is that progress of dredging was being critically delayed by late approval of the layout drawing. Moreover this delay already amounted to around 10 days. In this situation therefore, the Progress Override option provides the most sensible outcome.
 
Let’s now take the example a bit further. Assume that the dredging layout is finally approved early in Month-3, but the remaining dredging work is immediately suspended by the Engineer pending a comprehensive design review. Moreover this suspension remains in place up to the end of Month-6. Shortly after dredging is suspended, and with knowledge that this might last for several months, the Contractor carried out some preliminary filling work at the seawall trench. This was done to protect the small section of dredged trench from damage and siltation, and amounted to only 2% of the total filling. The 2 possible outcomes after rescheduling the programme are shown in Figure-5a (using Progress Override) and Figure-5b (using Retained Logic).
Figure-5a and 5b give a very different result compared to Figure-4a and 4b. This time the Retained Logic option produces the most sensible outcome (see Figure-5b). The occurrence of out-of-sequence filling in these circumstances should not override the prevailing logic. Clearly the critical issue affecting progress from the start of Month-3 to the end of Month-6 was the suspension to dredging, and this governed the earliest projected date for completing the Works.
The table below compares the different outcomes produced by the Retained Logic and Progress Override options. It is submitted that the most sensible result is that the 2 events have caused critical delay amounting to 110 days. Moreover this outcome is achieved by using a combination of the 2 scheduling options. Using only the Progress Override option underestimates the impact, whilst the Retained Logic function overestimates it.
 
The example above is a reminder that slavishly using one or other of the 2 scheduling options discussed here can lead to errors in defining the critical path, as well as the extent of critical path delays. If not treated carefully, this simple programming function can have significant consequences with respect to entitlement to time and money.
Continue reading
10571 Hits
0 comments

Make report to Show only some WBS in Gantt chart


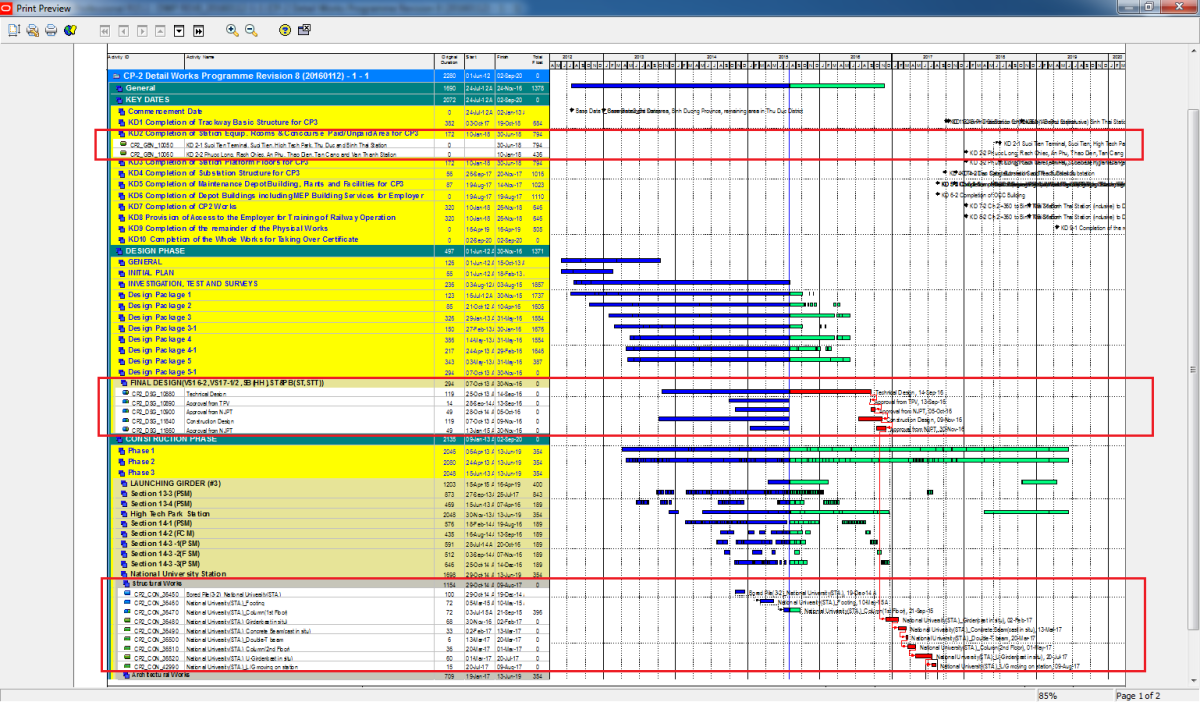
Sometime you need to make a report which focus on some WBS only. Like in this picture:

1

However, the Gantt chart show all other bar and make you distracted.

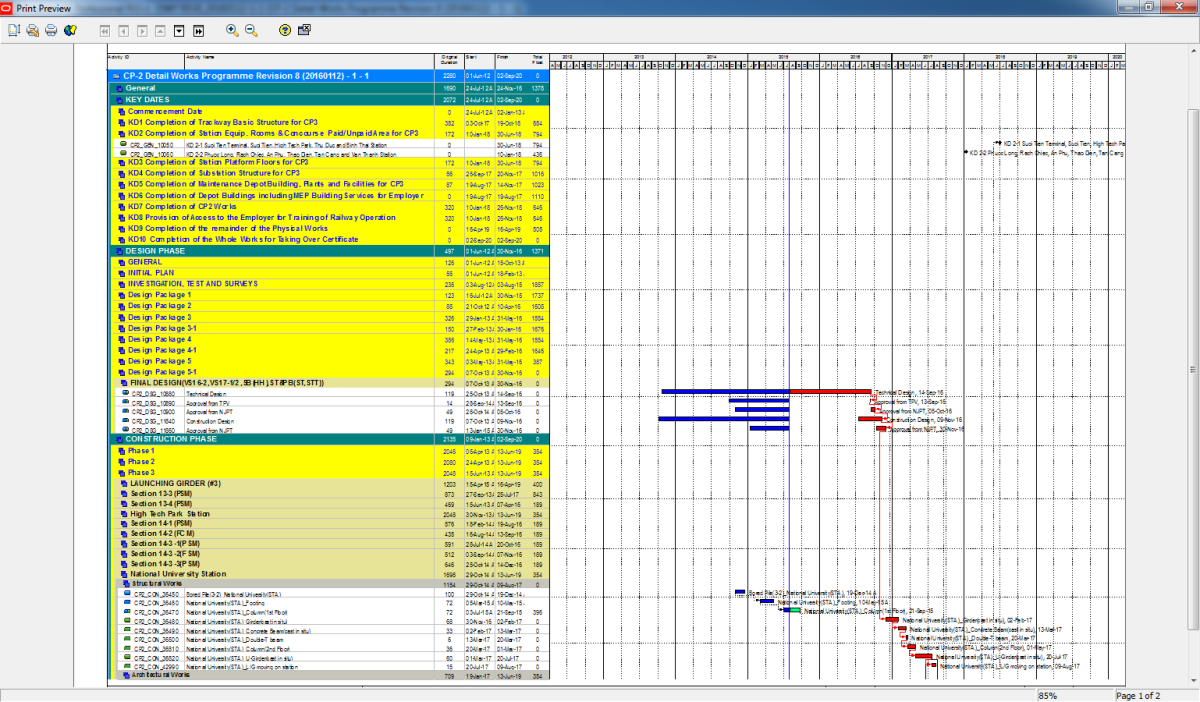
How about we can make it like this:

Well, much more cleaner. All unnecessary bars is hidden.

I will show you how.

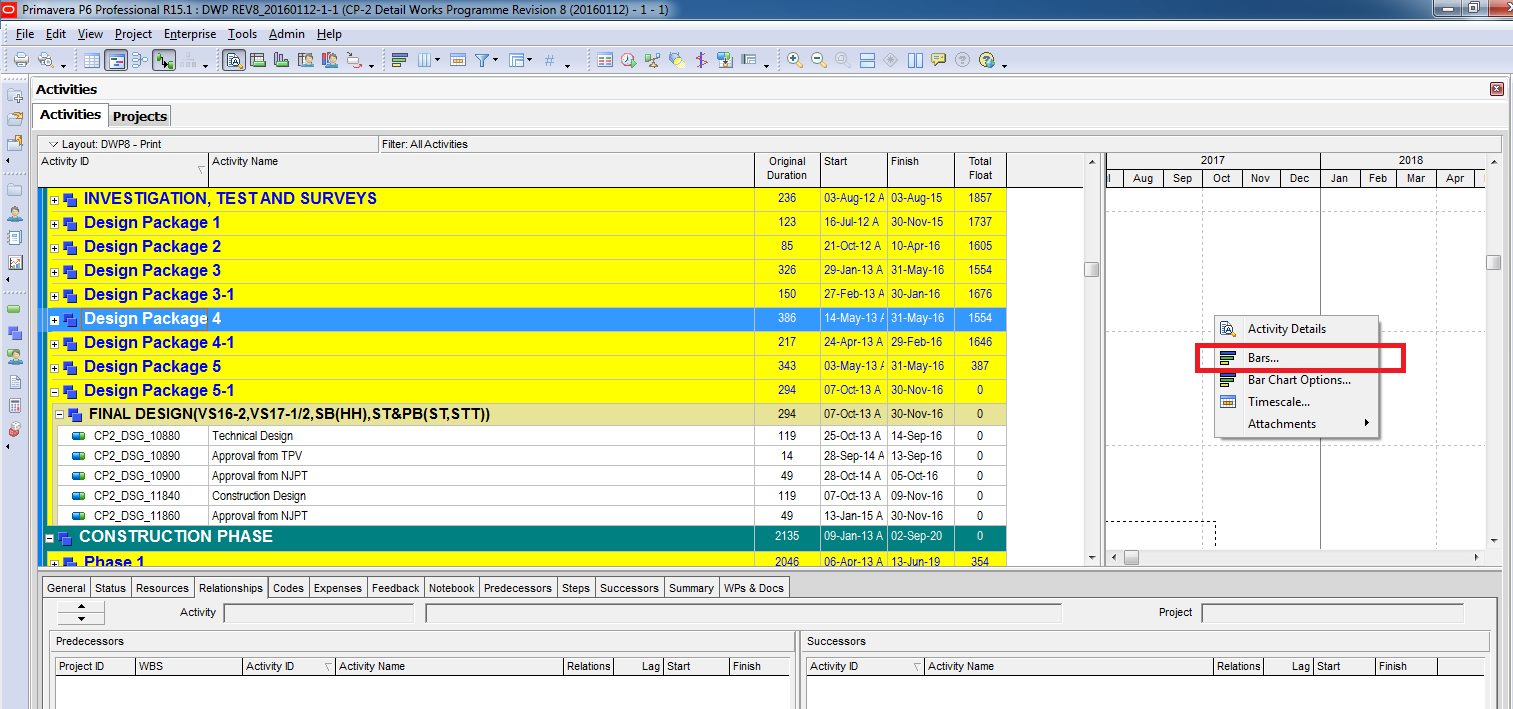
Right click on Gantt chart area. Click on Bar:

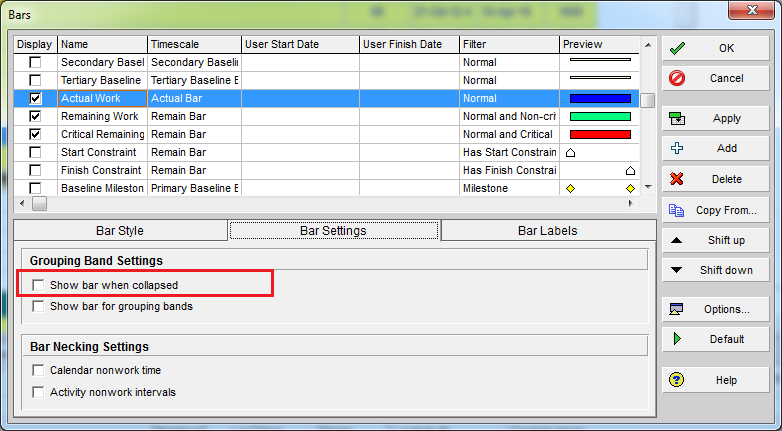
You select the Bar which is showed in Gantt chart. By default the “Show bar when collapsed” option is checked. Now you uncheck them:

4

You will do this for each bar.

Then you will have a very clean Gantt chart.

Tags:
Continue reading
4341 Hits
0 comments

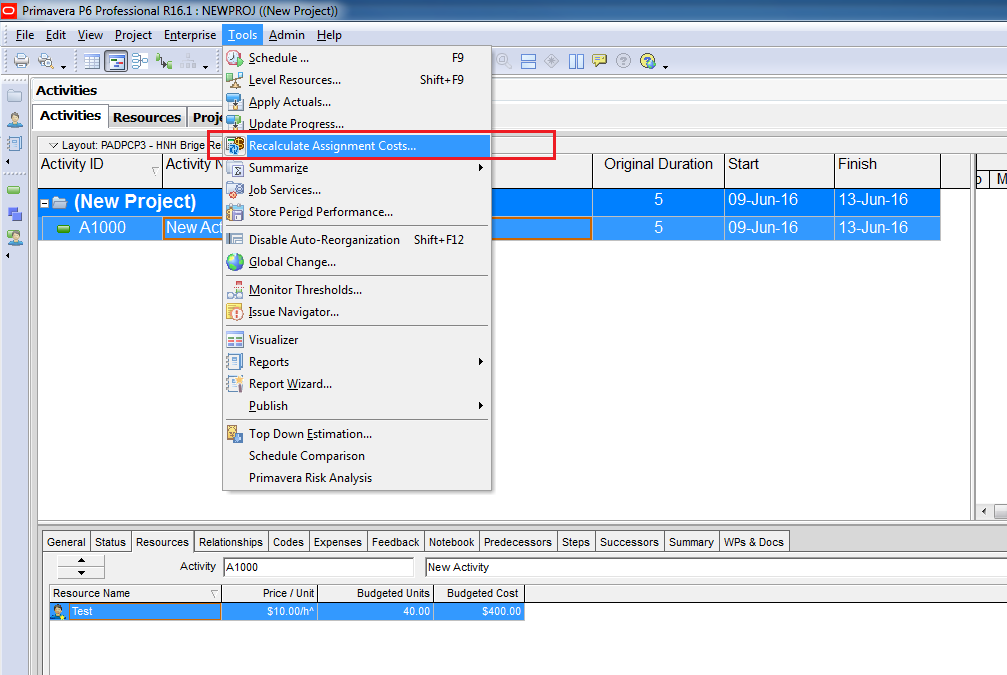
What does The Carat (^) Symbol next to the Resource Price/Unit in Primavera P6 mean?


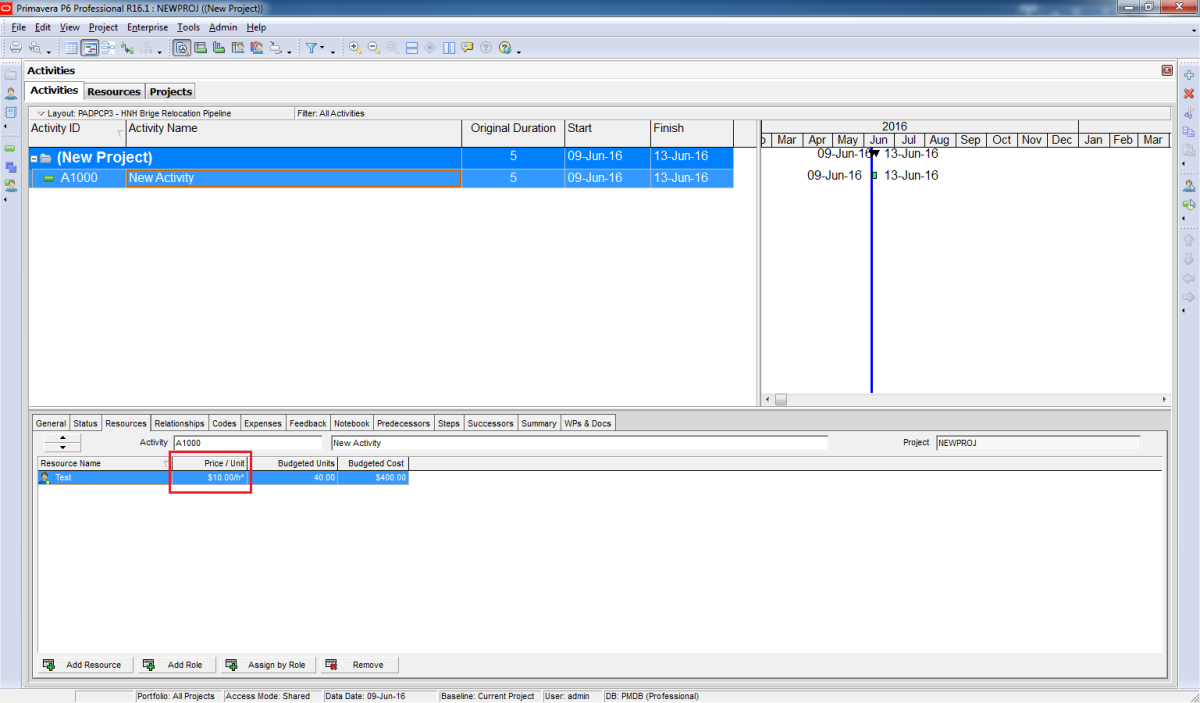
1

The carat (^) is displayed when the resource does not have a price/unit assigned.


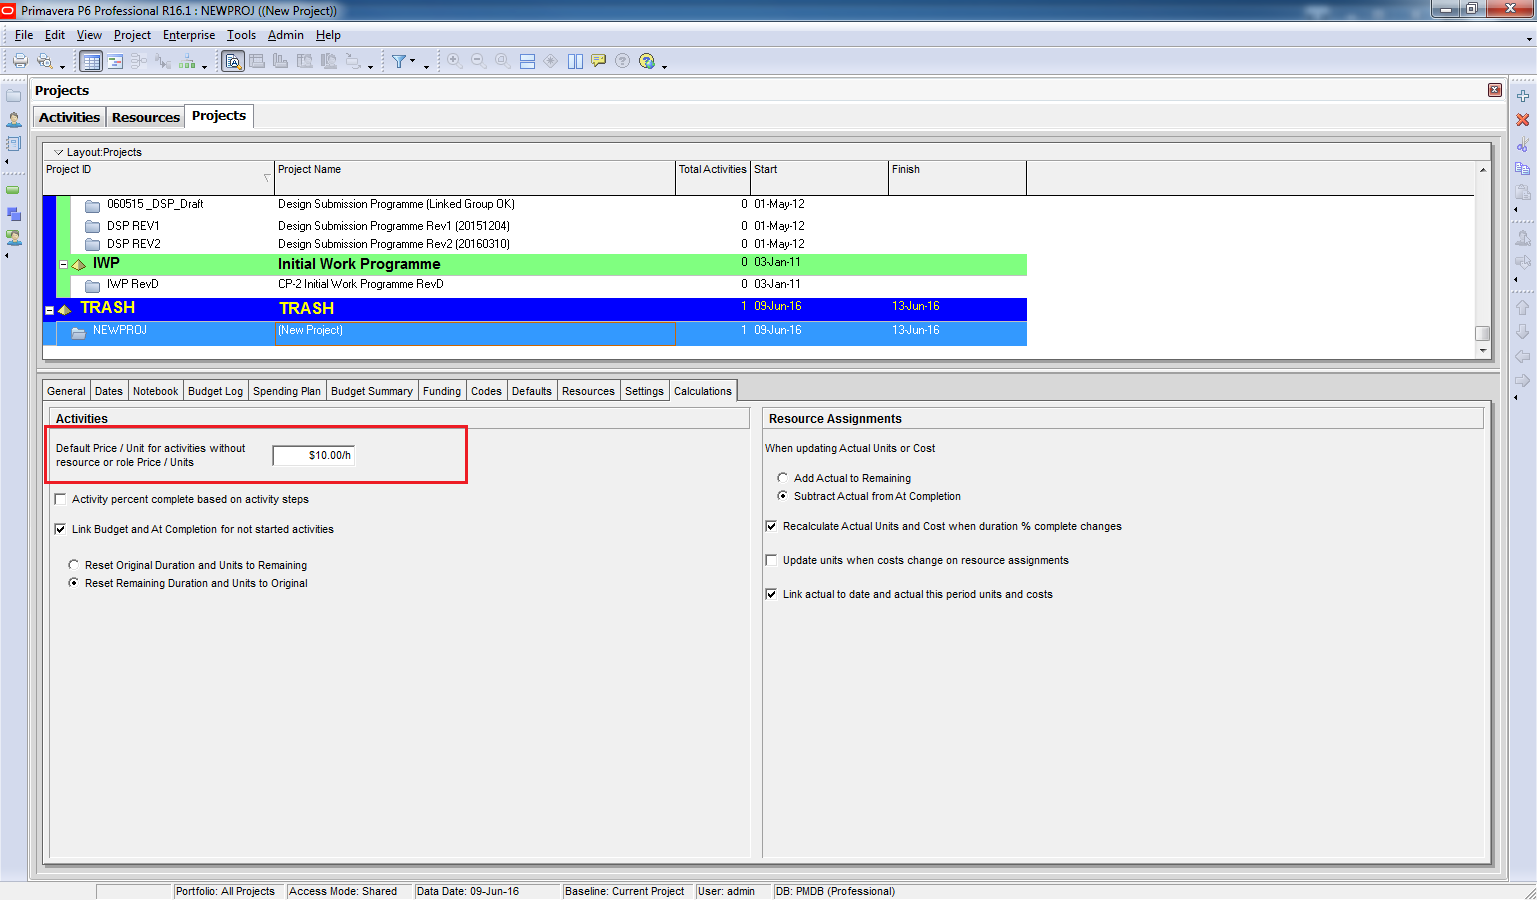
If resource does not have price/unit, Primavera will use the Project level price/unit which is defined in Project window -> Calculation tab

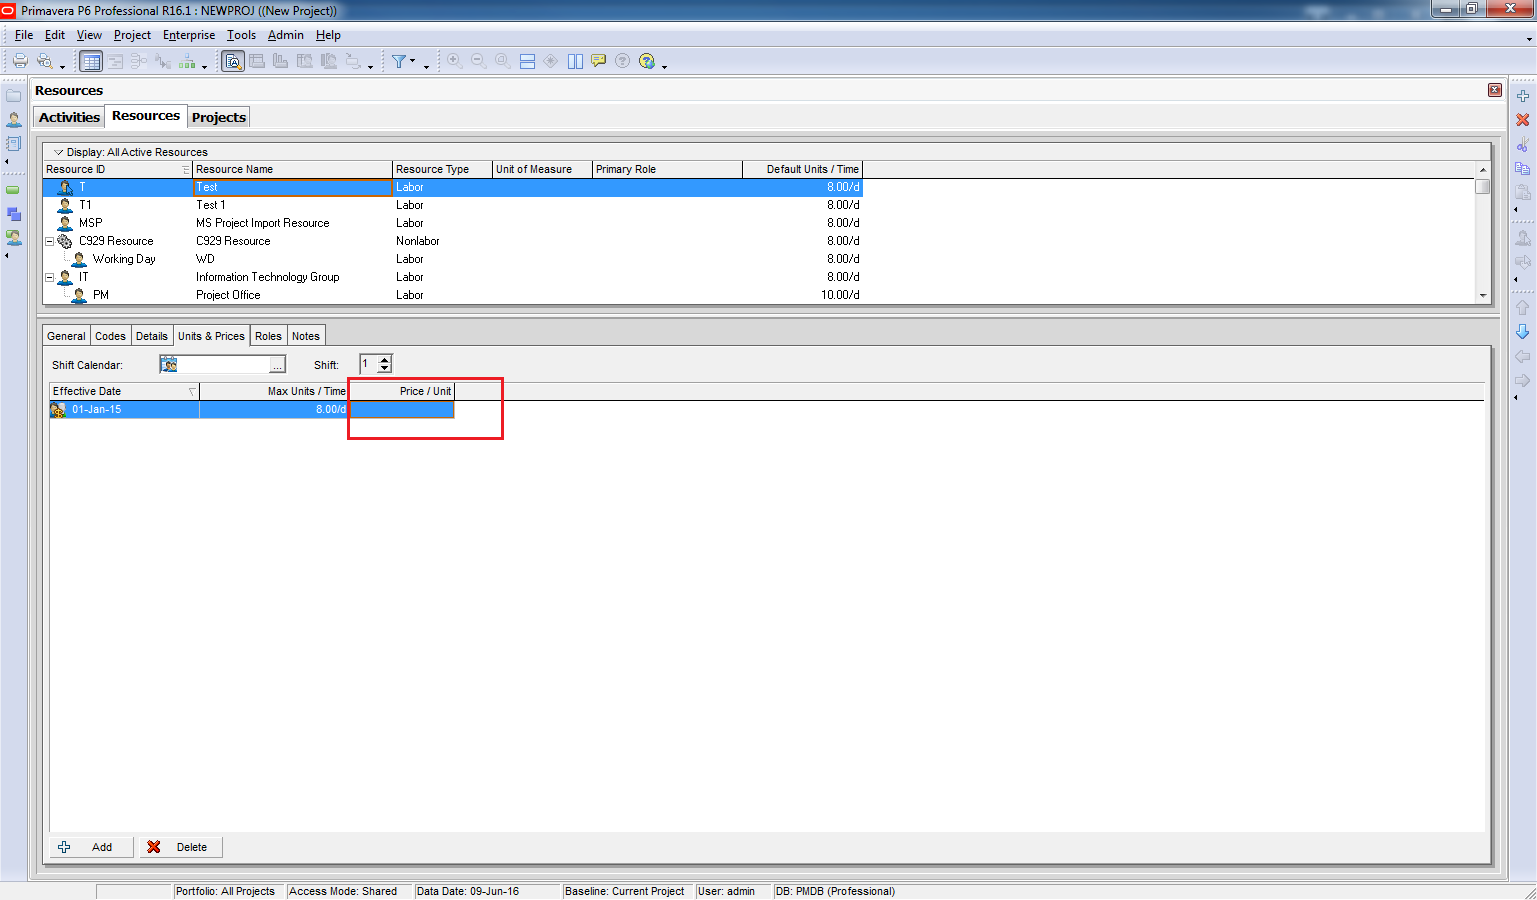
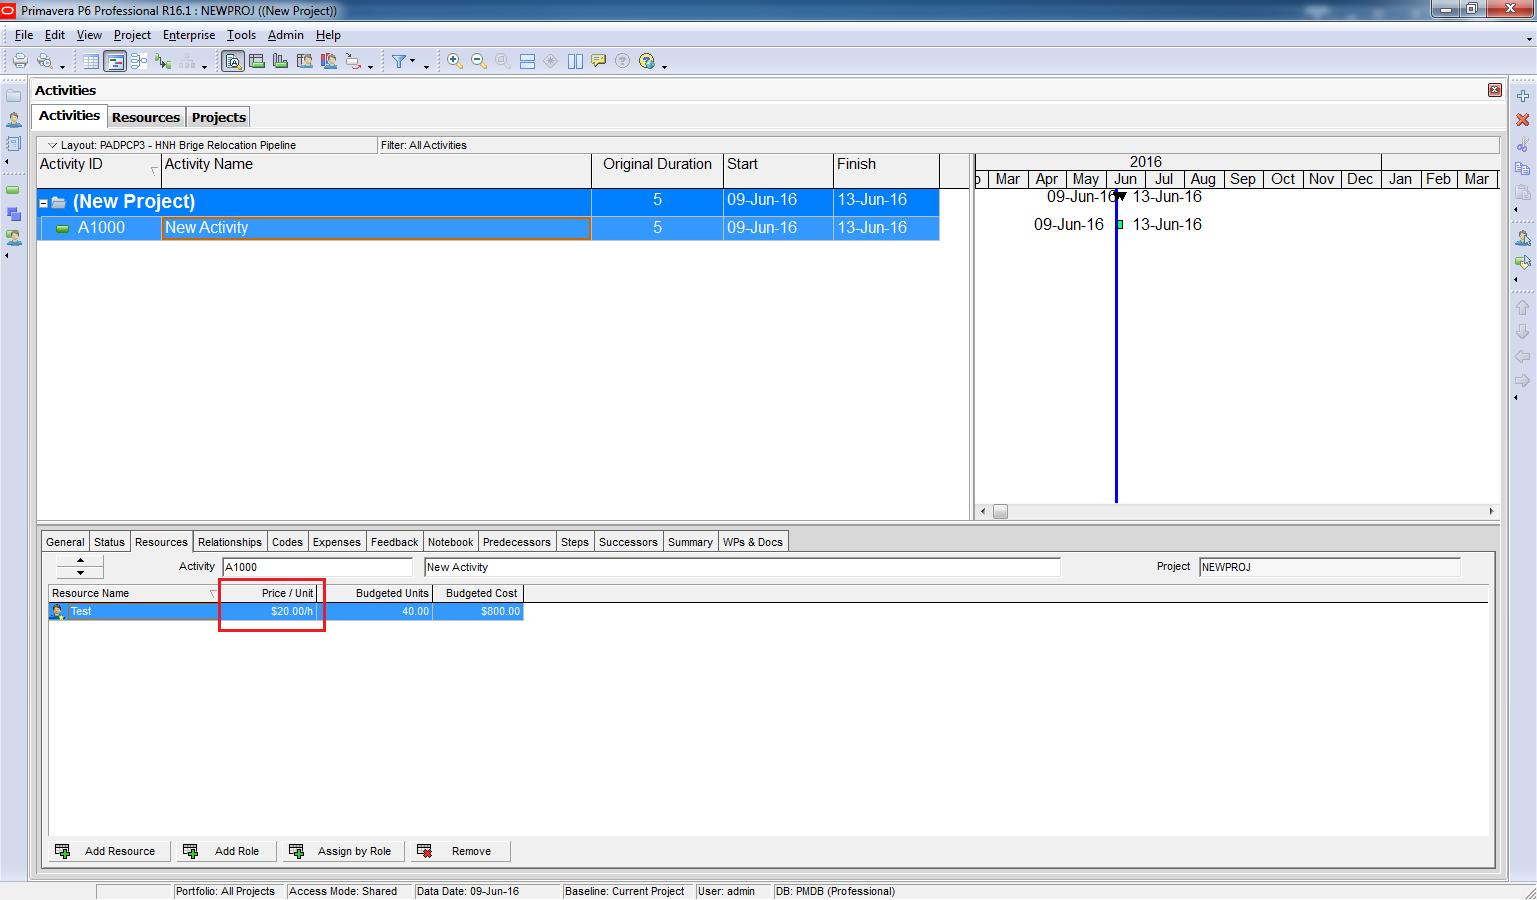
Now if you define price/unit for the resource like this:

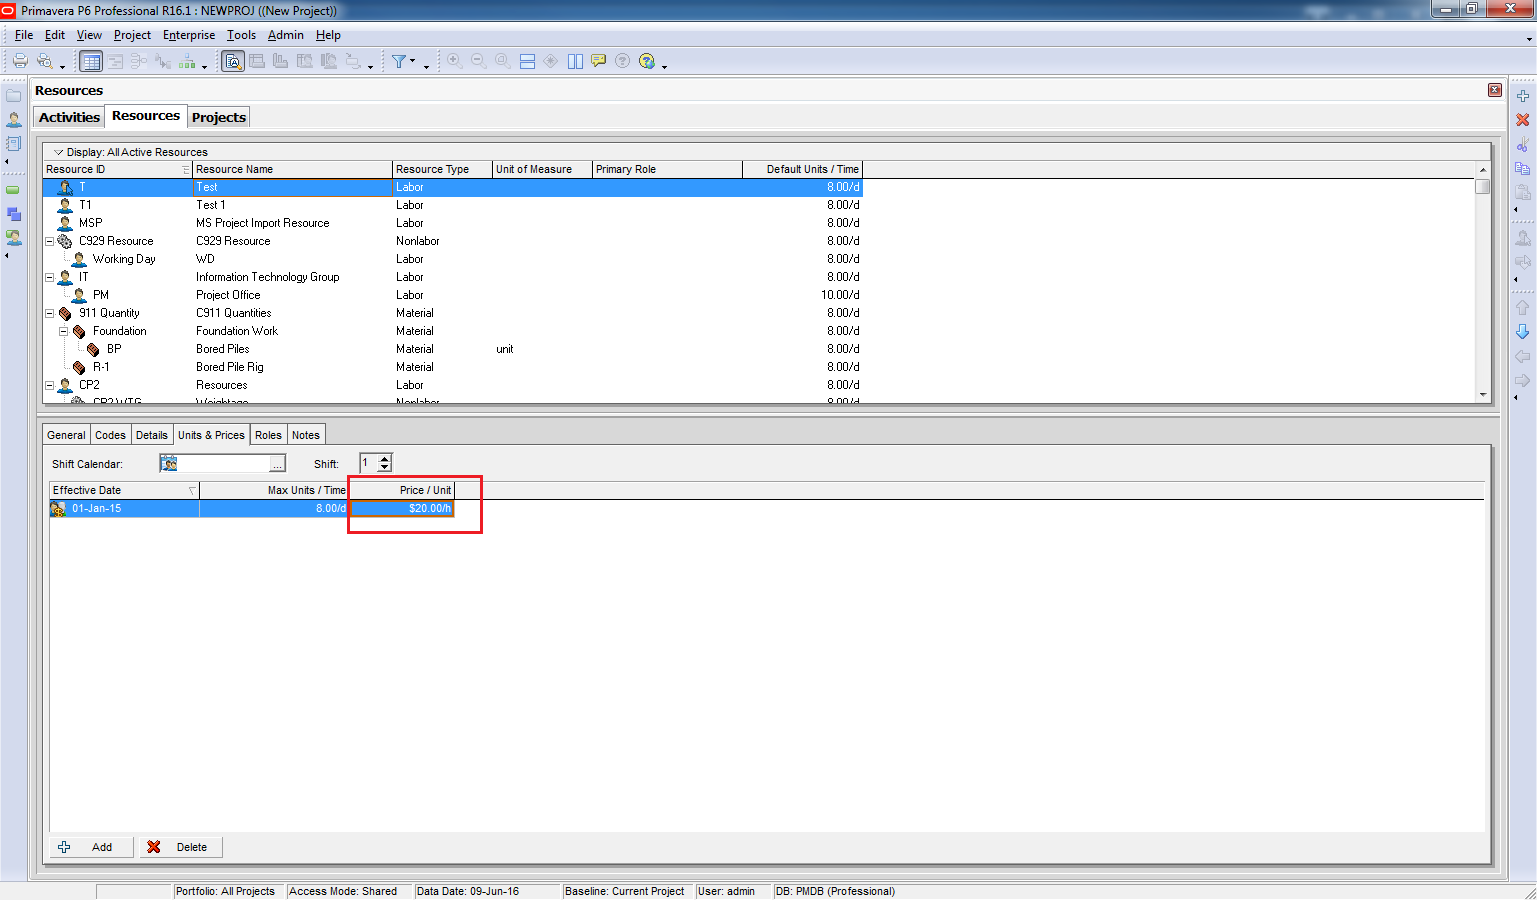
Primavera will now use the price/unit from resource.

However you have to run “Tool -> Recalculate Assignment Costs” to refresh the data.

Click on Recalculate

5

Now you can see there is no carat (^) symbol in the price/unit and that price is taken from Resource.

Tags:
Continue reading
16826 Hits
0 comments

Incorporating Risk Assessment into Project Forecasting

Incorporating Risk Assessment into Project Forecasting

Author: Dione Palomino Conde Laratta, PMP

Company: ICF International - USA

Phone: +1 (858) 444-3969

Dione.laratta@icfi.com

Subject Category: Project Risk Management and Cost Estimating


Brief author profile

Dione Laratta (MBA, PMP) has 16 years of experience in the energy industry with the last 8 years focused on project management.

She currently serves as a Project Controller with ICF International on a $200 million environmental project involving mitigation for construction of a transmission line (TRTP).  She is responsible for overseeing budget forecasts, risk assessment, schedule controls, and subcontractor management using sophisticated budget managements tools that are integrated throughout the project.

Her additional project management experience includes five years as the Planning and Control Manager for a $30 billion refinery program for the third largest Oil and Gas Company in the world.

Acknowledgements

This paper presents the results of a risk assessment approach applied to an environmental project. The author wishes to express her gratitude to all who participated in the risk workshops conducted as part of this paper. The author also wishes to express my gratitude to the reviewers of this paper for their comments and suggestions.

Abstract

The science of project management was founded, in large part, to manage risk and prevent it from negatively affecting project objectives, schedules, and budgets.

Risk in any project is unavoidable. Fortunately, there are proven methods to identify and analyze potential threats so that appropriate risk responses are developed and the project's level of exposure is controlled.

Risk analysis has become an important discipline within the field of project management. It involves prioritizing risks and assessing each identified risk's probability of occurrence and potential impact, whether positive or negative.

This paper explores both qualitative and quantitative risk analysis techniques applied to the environmental industry. It explains how to incorporate risk assessment into forecasting and shows how a project was able to increase forecast accuracy from 50% to 95% by using the described approach.

Introduction

In a business world that can transform in the blink of an eye, complexity is the new norm. On top of that, add forces of nature and you are entering the environmental industry.

Forecasting for a project that can be impacted by rain, snow, drought and wild fires can be very challenging since there is always “something in the air.” To get an accurate gauge of these risks – and opportunities – across the project, project executives are appealing to risk management and incorporating its results into the forecast process.

The Risk Management Process

Risk is inherent in projects. One can never overcome all potential risks in a project, but preparation, planning and execution can mitigate much of the risk.

Successful management of a project’s risks gives you better control over the future and can significantly improve the chances of you reaching your project objectives, including scheduling and budget objectives.

Figure 1 shows a summary of the risk management process and its connection with the forecast.

 
  Forecast

Figure 1 – Risk Assessment Process/Forecasting Process

Phase 1 – Identify Risks

The first step is to identify all risks that could realistically affect the project. This activity is best performed by the project team rather than by one individual. Depending on circumstances, it can be useful to obtain input from your customers, subcontractors, vendors, and other stakeholders involved in the project. Engaging them in the process can help your stakeholders become more committed to the project.

The approach used to identify the risks for our example was a brainstorming session.

In a brainstorm session a team works together with the help of a facilitator. The facilitator encourages everyone to participate in a free-flowing conversation amongst a group of knowledgeable people without criticizing or rewarding ideas. S/He provides guidance throughout the meeting by using structured questions and templates to foster the discussion.

Ideally, all stakeholders should eventually participate in the brainstorming sessions, but the initial Risk Identification Workshop should be restricted to a small number. Choose those who will be full-time members of the project team, have key responsibilities, and cover critical technologies and processes. As the project moves along, new workshops should be performed to incorporate more stakeholders and update risks already mapped.

Prior to the Risk Identification Workshop, participants should receive support documentation such as the statement of work (SOW), the baseline budget and current forecast as well as the Risk Breakdown Structure (RBS) and Work Breakdown Structure (WBS).

The dynamic of the brainstorming session should be discussed between the project manager and facilitator. For example, deciding if discussions will be conducted according to the WBS or RBS, identifying the participants, and defining the number of participants per knowledge area.

During the session, all potential risks are captured by the facilitator and then condensed and refined in order to be validated and classified.

The template used to identify each risk has the following fields:


  • Risk Description
  • General Information
  • Causes
  • Potential Impact (Time-Days)
  • Potential Impact (Cost- $)
  • Period of Occurrence
  • Risk Status (Active, New, Completed, Canceled)
  • Category (RBS classification)
  • Risk Classification as Opportunity (+) or Risk(-)

Phase 2 – Qualitative Analysis

The Qualitative Analysis consists of the methods used to prioritize the risks identified.

Each risk is classified on three variables: impact on cost and schedule, probability, and importance to the project. To simplify the analysis, the importance to the project was indicated by the multiplication of probability times impact.

Tables 1, 2 and 3 show the range used to estimate the severity of the impact and the probability of the risk occurring.


Table 1 – Schedule Impact


Table 2 – Cost Impact


Table 3 - Probability


Based on the complexity and size of the project, a risk tolerance with a lower limit of 4% and an  upper limit of  14% was used, which means that risks with a probability and impact higher than 15% are considered severe and therefore must have a risk response.

Phase 3 – Quantitative Analysis

The Quantitative Analysis consists of evaluating the magnitude of the risks previously classified. It incorporates cost and schedule impacts and evaluates pessimistic and optimistic scenarios.

Based on the forecast and the baseline budget, it was possible in our example to identify potential impacts on schedule and cost.

An expected monetary value (EMV) was calculated for the list of prioritized risks by multiplying the probability (P) times the potential impact (I) in cost.


EMV = P x I


Figure 2 – Matrix Probability vs Impact

Phase 4 - Risk Response

Risk response determines actions and responsibilities to keep track of each risk identified and prioritized.

The response should be aligned with one of the following risk strategies:

  • Avoid: Change the project or some assumption to protect the project against the impacts.
  • Transfer: Transfer the consequences of a risk to a third party.
  • Mitigation: Aims to reduce the consequences or probability of happening.
  • Acceptance: Incapability of pursuing another risk strategy or consciously assume the risk.
  • Exploit:  Aims to foster the probability of an opportunity happening.
  • Share: Used when a partner has a higher potential to capture the opportunity.

Phase 5 - Risk Monitor and Control

Risk monitor and control consists of identifying, evaluating and planning the risks and responses.

New risks can be identified during the project and should be included and tracked with a list of risks at the management team meetings.  Severe risks and their impacts, probability, EMV and responses should be reviewed monthly.

Phase 6 - Integrating Risk with Forecast

After quantifying the risks, the forecast will be split into 3 different scenarios: optimistic, most probable and pessimistic.

The pessimistic scenario incorporates the EMV of risks and the optimistic scenario incorporates the EMV of opportunities identified. The most probable uses the forecast as is.

Graph 1 shows the forecast scenarios distributed through the year.

Graph 1 – Forecast Scenarios

Graph 2 – Risk and Opportunities – Expected Monetary Values (EMV)

Graph 2 shows the distribution through the year of the expected monetary values for risks and opportunities quantified. These numbers were incorporated into the revenue forecast and can be detailed as shown in the table below.

Table 4 – Details on EMV

By using the results from the qualitative and quantitative analysis one can improve the accuracy of the forecast and also support the understanding of the nature of the work being executed. It demystifies the work and its associated risks to top executives and the project management team.

Before introducing the risk assessment into the forecast process, executives in our example project had a hard time understanding why there was often a large difference between the forecast and the actuals, as some months would vary by almost 50%.

Graph 3 shows how volatile and hard to control the environmental industry is, breaking down the risks according to its source.

Graph 3 – Risk Sources

Observing Graph 3 it can be seen that almost 10% of the risks were unforeseeable.  They were related to forces of nature such as rain, snow, wildfires, or accidents. Another 75% were related to external sources such as permits, taxes, regulations, other contractors participating in the project, clients, unions, competition, environmental conditions, the economy and market forces.

Being able to anticipate when most of these risks will happen, and to quantify and incorporate them into a regular forecast process, enables the project team to be more accurate and aware of potential risks and opportunities. Forecasts should be revised on a regular basis, and risk should be one of the topics discussed and updated.

Conclusion

It is widely accepted that risk management is a key contributor to project success, but integrating it into the forecast process can add even more value to the project.

There is no magic bullet to implement a process like the one presented in this paper, but there are some key guidelines you can follow. With that in mind, the following simple steps may help guide you as you begin planning your process to evaluate risk and improve your forecasts.

  • Define what values your project and organization will gain from this approach. Examples: reduce volatility to enable a more efficient use of capital. Increase customer satisfaction and transparency. Obtain the project and company goals – a project on budget and on schedule and a more accurate company’s forecast for the market.
  • Seek support and help. Get the involvement of your team and an executive sponsor. Explain the value of the process to the project and the organization.
  • Use templates to keep the process simple and straight forward.
  • Start in a small group with the core management team. Extend to other stakeholders once the process is more refined and established.
  • Keep the ball rolling. Define regular meetings with the project team to revise the forecast and risk analysis. Look for unanticipated risks as you already mapped and decided how to deal with the expected ones. Explore the different scenarios.
  • Support  the development of an organizational knowledge base. Create a database for the risks mapped and share with your team and organization.
  • Develop a monthly report with the three scenarios forecasted and highlight the most relevant risks and upcoming opportunities.

Appendix  - Glossary

  • Risk is an uncertain event that may result in a positive or negative impact on project objectives.
  • Qualitative Risk Analysis is the process for prioritizing risks for subsequent further analysis or action by assessing and combining their probability of occurrence and impact.
  • Risk probability and impact assessment is a method for "investigating the likelihood that each specific risk will occur" and a method for explicating their "potential effects" on the project which can be positive (risk is an "opportunity") or negative (risk is a "threat")
  • Risk Severity is a risk classification in terms of impact and probability of occurring. The tolerance to risk will define the thresholds.
  • Brainstorming is an information gathering technique used to collect requirements for the project. Uses the project team or experts to creatively identify risks, ideas or solutions.
  • RBS: Risk Breakdown Structure
  • WBS: Work Breakdown Structure
  • Risk categorization is the act of linking identified and evaluated risks into the RBS or WBS.
  • Quantitative Risk Analysis is the process for numerically analyzing the effect on overall project objectivities of identified risks. Based on the results of the Qualitative Risk Analysis the Quantitative Risk Analysis is performed on risks that have been prioritized.
  • Expected Monetary Value Analysis (EMV) determines an overall ranking of risks multiplying the probability times the impact of the risk, creating different scenarios that may or may not occur.

References

-          Real-world Risk Management. White Paper. PMI. http://www.pmi.org/Business-Solutions/~//australia/media/PDF/Business-Solutions/Risk%20Management_FINAL.ashx

-          Project Management Institute. (2015). A guide to the project management body of knowledge (PMBOK® guide) – Fifth edition. Newtown Square, PA: Author.

Continue reading
5955 Hits
0 comments

Why is P6 the software tool of choice for planning?

Primavera allows for top level planning as well as being ideal for managing the intricate details. This enables project managers, planners, planning controllers and other associated professionals to have instant access to all the project information they require at the touch of a button. It also means that all parties can be kept updated within one system, reducing duplicate information and keeping everyone in the loop.

There are number of other P6 features which makes it unique and recommended tool for planning and will make a planner or a project manager life easier by providing structure, access to information, monitoring progress and reporting mechanisms capability:-


Perfect for Project-focused Business functions - Primavera project portfolio management solutions are also suited for any company with project-focused business functions such as Construction program management, Capital asset maintenance,  Software system development and deployment, Enterprise investment portfolio management, Resource productivity and capacity planning, Product design, manufacturing, and implementation program management etc.

High performance project management - The recognised standard for high performance project management Primavera handles large-scale, highly sophisticated and multifaceted projects. Organise projects of up to 100,000 activities with unlimited resources and an unlimited number of target plans. Enhanced fiscal accountability to customers to identify common scheduling pitfalls and quickly remedy them. Track costs and gain insight into change orders and forecasts. P6 allows top level planning as well as being ideal for managing the intricate details. All the parties can be kept updated within one system, reducing duplicate information and keeping everyone in the loop. Primavera P6 Implement sound risk management principles, reducing the risks associated with projects such as delays in delivery and resource shortages. It reduces risks of schedule inconstancies, errors, or overrun issues. P6 helps identify and mitigate risks in the course of planning and controlling projects. 

Optimized Resources – It helps to carefully monitor resource availability and adjust scare resources to meet project demand. Furthermore, the software can help identify areas where resource cost may be reduced by analysing trends and costs. Primavera has resource levelling option which is very handy in optimizing resources.

Enhanced visibility – Everything is included in the programme so you can easily see what’s going on with a project at any time.  It allows all data to be entered, tracked and analyzed in one location. An unified project view for all participants and stakeholders.

Improved Forecasting – Having up to date information means that you are able to clearly see where there is likely to be overbooked or underutilized resources and can plan accordingly. As the project progresses, the project may require additional resources/activities to meet stakeholder demand. Within P6 schedulers can create forecasts for resources, activities and other project needs.

Instant and Quicker access – Keeping track of progress with time and resources and getting information whenever and wherever needed. Usage of only one system which gives you all the information needed which saves time and cost by not having to refer different tools.

Tracking Features – The tracking features of Primavera P6 allows to rapidly generates wide range of reports

Enhanced Communication – Projects spanning large geographic areas requires hundreds of workers, engineers and many contractors. Primavera P6 enables executive staff to communicate with other stakeholders easily. Furthermore, notes can be made to the schedule in the software to ensure all users see the message.

Improved Collaboration – Since communication is enhanced throughout a project, it’s easy to see how improved communication translates into improved collaboration. 

Gives Employees user access in schedule creation/update- Site Engineers can create schedule, turn in timesheets and update progress.

"This blog is writen by Vishal K Singh, ProjCon. ProjCon is exclusive, niche and rapidly growing Project Controls Consultancy offering innovative, advisory, implementation, technical and training support to our Clients. Our consulting services enable effective use of Project Controls technology, methods and practices for EPC (Oil & Gas, Power, Defence and Infrastructure) industry customers worldwide.

Our comprehensive array of products and services provide powerful, affordable solutions to virtually all aspects of the Project Controls. Contact us to find out how we can help you to build/strengthen your Project Controls capability. For more info, visit us on www.ProjCon.co.uk"

Continue reading
23162 Hits
0 comments

Effective Engineering progress monitoring


Engineering progress is commonly measured by assigning a weight, usually the required number of required manhours, to each task/deliverable. Once the task is performed/ the deliverable is issued, the corresponding manhours are earned.

The earned progress divided by the total number of manhours gives the % progress.


As each engineering task/deliverable is scheduled at certain dates, it is possible to anticipate the progress that should be earned at a given date. It is the planned progress.

At regular period, usually on a monthly basis, the actual progress of each activity/deliverable is measured against the planned progress. An actual progress less than the planned progress might show a lack of resources and a need for increased mobilization to get back on plan, following a (re-)forecast progress curve.

Although such progress measure is commonly used, it could be deceiving. It indeed reflects rather well the progress of engineering on its own but not how well is engineering supporting the Project schedule.

Let’s consider that engineering must issue 2 material requisitions, an urgent one for a Long Lead Item and another one which is required later on. Engineering will earn progress whatever requisition it issues, even if putting the Project in delay by issuing the non urgent requisition first.

One sees that the above measure of progress alone is insufficient. It must be complemented by monitoring that important Milestones are met.

These Milestones are first of all, the ones associated with the issue of the Requisition for the equipment. Long lead items have naturally to be purchased early. All equipment and packages also need to be purchased as early as their technical definition allows. Indeed, engineering development is highly dependent on information from vendors. The sooner the purchase orders are placed the sooner the vendor information will be available.

Next come the Milestones associated with Bulk Material Procurement to support construction, such as the Piping MTO and the Structural Steel MTO (for an off-shore Project).

Then come the Milestones associated with Construction. These are the IFC Plot Plan, a pre-requisite to start any site work, and the IFC P&IDs, a pre-requisite to the issue of Piping isometrics. The 50% IFC Piping isometric milestone comes next, which typically falls half way through the Project, as ensuing works, such as pre-fab and erection have a rather incompressible duration, due to site constraints (capacity of pre-fab shop, space constraints for erection limiting the progress).

Even if engineering deliveries are in sequence, the above engineering progress measure might still be deceiving, as it will only reflect the amount of engineering work completed and not the workfront made available to construction.

Let’s consider for instance that two foundations are to be cast. The first one is a very large foundation and the second one a small one. Issuing the drawing of either the large or small foundation will earn engineering the same progress, although it will open quite a different workfront to Construction.

One sees the necessity to measure the issued Workfront.

In the case of foundations, for instance, this will be done by monitoring the cumulative quantity of concrete (m3) of all issued IFC foundation drawings.

Producing an S curve, such as the one shown here, showing both planned and actually issued quantities will give a true picture of how well engineering is supporting civil works.

One will similarly monitor, for an On-Shore project, the cumulative quantity of steel (tons) of issued IFC Structural drawings.

The cumulative tons (or dia inch) of IFC issued Piping isometrics will show the available piping workfront.

Such progress curves, showing the actual versus planned available workfronts are instrumental to monitor engineering progress, identify shortage and take corrective actions (increase mobilisation).

It is not perfect however and can still be deceiving, in case of out-of-sequence issues: engineering may have issued drawings representing significant quantities, but that does not generate construction workfront as such works can not be performed at this time (due to lack of access or pre-requisite for another work to be completed before, for instance).

Continue reading
3902 Hits
0 comments

Categories

Search

Australian Open Learning Pty Ltd t/a Project Controls Institute, Australia | RTO CODE :45806