Blogs


Welcome to Project Controls Institute, Australia blog.

Selection of thoughts and tips shared by Project Controls community.

test

Why EPC Contracts are bound to be delayed


Such integrated model existed, up to the eighties, but has disappeared, Engineering companies having first cut their construction labour and equipment then their construction supervision.

The EPC Contractor one will find today is typically an association of two companies, one doing Engineering and Procurement (E&P) and the other one the Construction (C).

There are 3 types of associations between these two companies: a JV, a consortium or a sub-contract. The most frequent is the last one, the Construction contractor being sub-contractor to the Engineering Company, to which is awarded the EPC Contract.

Let’s look at the pro’s and con’s of each type of association to understand the paradigm leading to systemic delays in EPC contracts execution:

The Joint Venture seems the ideal: both parties share a common profit or loss. There is no conflict of interests.

The issue lies with how one party controls the costs charged by the other party. It is very difficult for an Engineering Company to control the manhours of manpower and equipment charged by a Construction contractor. The Construction contractor is likely to inflate the latter to make its own profit on these charges, regardless of the profit it could get from the JV.

The consortium has each party responsible for its scope, expenses and profit. This provides an incentive for each party to minimize its costs. There is a non recourse clause in the consortium agreement that prevents one party to claim to the other.

The issue lies with the impact that could be suffered by the Construction partner due to the delays in drawings and materials deliveries from the Engineering company. These delays will typically result in idle manpower and equipment. The Construction contractor will not be able to claim the resulting extra cost from the Engineering company. Knowing this, it will include such costs in its bid which will affect the price competitiveness of the consortium bid. This type of scheme is therefore not often seen…

Finally, the most commonly found type of association is the sub-contract. The Engineering company sub-contracts construction activities to a construction sub-contractor.

The construction contractor is commonly paid applying unit rates to installed quantities, e.g. so much for a cubic meter of concrete cast, so much for a ton of pipe erected  etc. This means that the construction contractor will be paid a fixed amount for a given amount of work done whatever its actual consumption of resources (manpower, equipment) is. In other words, the construction contractor bears its productivity risks.

The productivity of the sub-contractor is however highly dependent on timely deliveries of drawings and materials by the Engineering company. In case drawings and material deliveries are delayed, idle time of manpower and equipment will be suffered by sub-contractor, as sub-contractor will still be paid the same amount for each erected ton of steel and the manpower and equipment will require to be mobilized over a longer period.

In theory the sub-contractor could claim for such extension of time and related costs. Such claims are indeed made possible by the sub-contract type of association, contrary to the consortium.

In practice, the sub-contract usually contains difficult to match conditions to such claims. The claim might, for instance, be eligible only of there is a proven overall – not local – lack of workfront. The sub-contractor might also be required to prove that the delay impacts the schedule critical path etc.

As engineering and material deliveries are always subject to out-of-sequence and delayed deliveries, and the above claims are difficult to make, the sub-contractor will be careful not to mobilize too early. The sub-contractor will rather aim to always be a little under mobilized to achieve the best productivity.

On the other hand, the EPC contractor will not be fully transparent with expected engineering and material delivery slippage as its interest is construction progress rather than productivity.

Here, I believe, lies the systemic factor that leads to delays of EPC Projects organized under such contractual schemes.

As such scheme is the norm, one deducts that the owner is more concerned with price than schedule and has accounted float in its overall schedule for delay in the execution of the EPC Contract.

The scheme still entices the EPC contractor to complete as early as possible to avoid both Liquidated Damages and extra costs of prolonged presence at Site.

Continue reading
9369 Hits
0 comments

Schedule Risk Analysis; Are You Ready For It?


Introduction

Take your schedule, drop it into a Monte Carlo engine, apply some risks, press the button and in a couple of turns of the egg timer you have a set of confidence dates, some distribution curves and even a tornado chart or two. If you don’t get quite the answer you were looking for you can alter a maximum duration here, a risk likelihood percentage there and press the button again. Eventually you’ll get a result that supports your business case and doesn’t attract too many difficult questions. That’s the aim of SRA right? It’s a means to an end. 

It’s pretty obvious that the previous paragraph was designed to provoke the response “No! Of course that’s not right”. But be honest, how often is schedule risk analysis (SRA) completely unconstrained and unbiased, based on credible and technically accurate inputs and analysed by an experienced risk practitioner? Moreover when have you used the results to inform decisions on budgets, resource allocations and even the viability of the project?  

Regardless of the reason for undertaking SRA, every project manager must consider whether they and their project are ready to go through the unbiased process required to produce a beneficial SRA output and to accept the results. 

This paper doesn’t intend to discuss the benefits and process involved in undertaking an SRA, as these are already well documented. Instead the paper seeks to ask the question ‘are you REALLY ready for SRA?’ by examining the true components of a robust analysis and the potential impact of compromising any one of them. 

However, before you read on it must be stressed that this paper isn’t designed to turn you away from the idea of utilising SRA, as it’s a useful part of a project manager’s arsenal. The paper aims to give you a greater appreciation of how to plan for and conduct a quality SRA in order to gain the most benefit from it.


Components of SRA

It’s a common misconception that if you have a schedule and you have a risk register then you have all the components required to undertake an SRA. The fact of the matter is that there are a number other components that must be in place before an SRA will be close to meaningful. These components can be broadly grouped into three perspectives; 


Inputs

Appropriate unbiased and credible data required for a realistic SRA to be run. 

Enablers

Attitude of the organisation, governance, required skills, knowledge and time to undertake an SRA.

Outputs

Transforming the accepted outputs of the SRA into meaningful action.


It is the sum of all of these components that make up the SRA. The analogy of a house of cards is quite apt, if any one of these components is absent or has been compromised then the hard work involved in putting the individual cards together will be in vain. You will be left with a pile of cards with nothing meaningful to show for all your effort, or even worse, your house of cards will just about stand up, but on extremely weak foundations that may lead to key decisions being taken based on misleading analysis.

The following sections explore each of the perspectives above and provide the real questions you should be asking yourself to ensure you are ready to run an SRA. 

 Inputs

The inputs to an SRA are its foundations, if these aren’t solid then the outputs, analysis and decisions that come from the SRA will be baseless. I’m sure you’ve all heard of the phrase “Rubbish in; Rubbish Out”, or more specifically in the case of SRA, it will probably be “Bias in; Bias out”.

Before considering whether to undertake an SRA you as the project manager not only need to be assured that the inputs are well founded, but also, that you understand what it is you want to achieve by undertaking an SRA. 

The following four questions hope to prompt that thought process.  

  1. 1) Do you fully understand the purpose of running this SRA?  

Reasons such as; “to get the senior management off my back”, “because we have to convince the scrutiny department or client that we know what we’re doing” or “we need to show that we are going to meet out deadline” are not good reasons for undertaking an SRA and indicate that the benefits of SRA are perhaps not fully understood. 

Understanding the context, stakeholder expectations and having a clear understanding of the decisions your SRA is intended to support, will make it easier to gather the necessary inputs and “sell” the results to the stakeholders. There is no point going through the SRA process only to provide an analysis that fails to answer the questions you and your stakeholders wanting answers for. 

Understanding the purpose also allows you to focus the SRA on particular areas of the project that are of interest. For instance, if the project is 20 years in duration, but stakeholders are only interested in the likelihood of achieving the first deliverable after two years there is no point in developing a risk network for the entire project. 

If you can’t answer the question “what is the purpose of running this SRA?” with a valid, focused and unambiguous reason, such as; “we are trying to identify the phase in our project that is most likely to affect the likelihood of meeting our contract deadline” or “the penalty clauses in our contract mean that missing our deadlines could prove very costly – how much money should we be spending up front to mitigate risk and protect our profit”, then there is no foundation to run an SRA. 

  1. 2) Do you have estimates free of bias, obtained from multiple sources and which are considered credible?

The answer to the questions; “how do you know whether your estimates are free from bias and are credible” is that you can’t, but you can take action to reduce bias and increase the credibility of your estimates.  

Only if you have consulted as many people as is practical, with the expertise and experience required, on an individual basis (to avoid ‘groupthink’), can you say for certain that your estimates are as free of bias as possible and therefore, as credible as possible. 

As tempting as it is to believe, putting poor estimates through a modelling tool does not make them any more accurate and certainly does not validate them. Referring back to the ‘House of Cards’ analogy, if the foundations are weak, you cannot be sure that the structure they are supporting will not collapse under even the lightest challenge.

  1. 3) Does your risk network contain sound and tested logic?

If the risk network is constructed using any scheduling technique other than left to right with complete and free flowing logic, the answer to the above question is ‘no’ and the SRA will fail to accurately portray the impacts of estimating uncertainty and event risk. 

The risk network forms the backbone of the SRA. Regardless of the level of the risk network and the tasks it includes, it must allow delays to honestly and fully propagate through without interference (i.e. constraints, lags) to provide a meaningful output. 

  1. 4) Have all assumptions upon which the risk model is based been clearly articulated and documented?

 Any analysis is only as good as the assumptions with which it is presented. It’s highly likely that some information needed to undertake an accurate SRA is either not available or is unstable at the time required. In these cases planning assumptions should be made in order to complete the SRA. 

These need to be documented to allow you to understand the results of the SRA when revisiting it at a future date. If the answer to the above question is “no” then revisit it to understand what factors may invalidate the SRA if they were to change in the future. 

Remember that an SRA will never provide ‘the answer’. Even the best quality SRA will never end with a statement saying, “the answer is X”.  Project management, as with life, is never that cut and dry; and it is part of the responsibility of the analyst to ensure that the results they present are not divorced from the assumptions and context with which the analysis was carried out.

It is clear that to ensure the results of the SRA are credible and provide value, time must be taken upfront to ensure that the inputs are meaningful and well thought out. Without credible inputs to the SRA, the results should not be trusted. 

 Enablers

Enablers are the things that allow a successful SRA to take place, free of interference, at the appropriate level and with the right analysis to answer the required questions. 

This paper is focusing on organisational enablers such as; knowledge, availability of resources, appropriate governance and organisational maturity. 

The following questions are intended to challenge whether you are in the position to make the most of the SRA and its outcomes. If you’re not, you must ask “why am I doing it?”

  1. 1) Do you have the right level of knowledge, experience and impartiality within the organisation to properly analyse the SRA results?  

It’s not too difficult to throw a few risks together with a high level schedule and click a button. Similarly it’s not hard to read results from a graph. However, would you or any of your team be comfortable explaining to senior management the detailed results of an SRA, the context and assumptions that underpin them, how they were achieved and what they do (and importantly, don’t) tell you about the project? 

If you want to get valid and impartial results that provide a meaningful insight to the project then you need people with specialist competence, training and experience. If you expect to run a meaningful SRA without the specialist skills, you run the risk of making decisions about your project based on un-informed analysis.  

  1. 2) Have you allowed enough time to fully engage with the SRA process, analyse the results and put actions in place?

Running an SRA is not a simple process; from experience an SRA invariably takes longer than you initially expect. Rushing it can result in poor quality analysis and can invalidate the whole outcome. 

An important point to remember is that SRA needs to be done to an appropriate level of granularity and should be iterative. SRA takes time and depending on the reasons for undertaking an SRA it may not be necessary to undertake it on the entire project. Consider what is appropriate to you and weigh the costs, time and effort against the potential benefits. 

  1. 3) Are you opened minded about the outcome and unconstrained by pre-conception? 

This question speaks for itself; if you already know the answer you want the SRA to provide, aren’t open to alternatives and are willing to manipulate the model to get the answer you want, then it’s a fairly futile exercise. SRA is not flawless; referring back to the second sentence of the paper; 

“If you don’t get quite the answer you were looking for you can alter a maximum duration here, a risk likelihood percentage there and press the button again”

Doing this defeats the object of the SRA and invalidates the process, analysis and any decisions made based on the outputs. 

It’s strongly recommended that an impartial third party is utilised to assure that the process is undertaken correctly, regardless of the result. If you are the project manager or senior stakeholder commissioning an SRA then it is your responsibility to ensure that the analyst is not unduly influenced by yourself or other stakeholders. If you think you know what you want the ‘answer’ to be, then don’t tell your analyst!

It is clear that enablers are a key aspect of running an SRA. Without aspects such as the knowledge, time and right intention of running an SRA, results of worth and value are impossible. 

Outputs

Outputs in the context of this paper are not referring to the technical analysis or various graphs that an SRA produces, these are produced regardless of whether the SRA is based on solid foundations or not. Instead, this paper is looking at the actions of the organisation and project team as a result of the SRA outputs.  

The three simple questions that you should ask yourself with regard to outputs may be difficult to answer. However, they need to be considered. 

  1. 1) Is your SRA analyst independent and free of un-due influence from the project team or senior management? 

If the answer is no, how can you trust the results and base decisions on them?

To ensure credible, valid and impartial outputs the operator needs to be independent of the project team or senior management. Without this you cannot assure yourself or your stakeholders that the outputs have been free of any influence that could have altered the results. 

  1. 2) Is the governance and culture in your organisation prepared to understand and act upon the outcomes of the SRA? 

“Prepared to understand”, what does this mean? Fundamentally, will you or your senior management accept the results of the SRA and try not to influence them to make a political point, or to ensure the continuation of the project. What other information will you be taking into account when considering the results?

As for “acting”; is the organisation ready to make the decisions that a SRA may highlight? For instance; “where shall we spend the £100K budget for risk mitigation?” or more contentiously, “should we cancel this project?” 

It’s also important to remember that SRA is just one of many tools used to inform decisions. There is nothing inherently wrong with basing decisions on the project manager’s experience, or ‘gut instinct’, but SRA can provide the evidence based analysis and perspective to support your gut instinct or indeed challenge it. SRA is another tool for the armoury, and should be used as such – not the magic bullet, but extra ammunition!

If the organisation is not mature enough to accept an outcome or ready to take action then ask why are you doing an SRA, what is the benefit to the organisation and the project?

  1. 3) Do you have the time and resources to act on the outputs of the SRA? 

This question goes hand in hand with its predecessor. Whilst you may have the intention to act, depending on what may be required, do you have the time or resource to actually do it. 

Identifying the reasons for undertaking the SRA, and conducting the analysis at an appropriate level, is key. If resources are not available, expectations must be managed at the outset of the SRA process so that the reasons for undertaking the SRA are not undermined.  

The actions of an organisation following the SRA are fundamental to success. If no action will be taken following the SRA, what value has it added? The effort put into the SRA must be matched by the effort put into the results to ensure that the right direction is taken by the organisation or project following the results.

Finally

Looking back at the question the paper is trying to answer, ‘are you REALLY ready for SRA?’, put simply; if you can’t answer ‘yes’ to all of the questions asked through the paper, and compiled in table 1, then realistically you’re not ready to get the best from an SRA. 

However, before you think, “well I just won’t bother then, as it all seems a bit too hard to do properly”, everything discussed can be overcome or managed. The key is to understand the weaknesses of the SRA to ensure you get the most benefit, or tailor the process to an appropriate level. 

The key points to remember are that in order to get the best from SRA you must: 

  • Understand the reasons for undertaking an SRA
  • Assure yourself that the process is impartial and unbiased
  • Apply it an appropriate level 
  • Be confident that the outcomes can be used to take decisive action for the good of the organisation. 

SRA is an extremely powerful tool that can provide huge benefit to projects and organisations when ‘done right’. So now, ask yourself, are you REALLY ready for SRA?


Desired answer

Do you fully understand the purpose of running this SRA?  

Yes

Do you have estimates free of bias, obtained from multiple sources and which are considered credible?

Yes

Does your risk network contain sound and tested logic?

Yes

Have all assumptions upon which the risk model is based been clearly articulated and documented?

Yes

Do you have the right level of knowledge, experience and impartiality within the organisation to properly analyse the SRA results?  

Yes

Have you allowed enough time to fully engage with the SRA process, analyse the results and put actions in place?

Yes

Are your opened minded about the outcome and unconstrained by pre-conception?

Yes

Is your SRA analyst independent and free of un-due influence from the project team or senior management? 

Yes

Is the governance and culture in your organisation prepared to understand and act upon the outcomes of the SRA? 

Yes

Do you have the time and resources to act on the outputs of the SRA?

Yes, to an appropriate degree


Table 1: “The Complete SRA Readiness Quiz”


Acknowledgements

The author would like to thank the following individuals for their assistance in developing this paper;

 Laura Smith – BMT Hi-Q Sigma

Russell Tarver – BMT Hi-Q Sigma

Jo Langley – BMT Hi-Q Sigma

Michelle Glasgow – BMT Hi-Q Sigma

Georgina Jones – BMT Hi-Q Sigma

Author:

Tom Olden
T: +44 (0) 1225 820 980 
E: tom.olden@bmt-hqs.com

Disclaimer
 
I hereby declare that the content of this paper does not infringe any copyrights and is owned by the author. 
 
 
Signed:  …………………………………………
 
                                              T. Olden


Continue reading
4978 Hits
0 comments

Progress, Position, Prediction- The key to completing projects on time

Key Words

Progress. Position. Forecast. Earned value. Change. Linear regression. S-curve. Schedule.

Abstract

Current methods for assessing activity progress, calculating project position and forecasting project completion (including the use of earned value analysis) are examined in this paper. The disadvantages of current forecasting methods are discussed with special reference to single data point extrapolation and the difficulty for non-specialists in analysing s-curves. A different method of forecasting project completion using simple linear regression and time series analysis is proposed which has real practical applications for project managers and allows them to easily and rapidly produce position and forecast data in a format that is understood by layman and specialist.

Introduction

The UK Construction Industry does not have a good record for completing projects on time. Constructing Excellence’s data from its 2012 report (the latest available) shows that the actual out-turn time taken for the construction phase of projects compared with the length of time agreed at the start of that phase dropped sharply in 2012, with only 42% of projects delivered on time or better, compared with 60% the year before.  Whilst this is the first time since 2000 that the KPI was below 50% the data shows that, on average, less than 40% of projects finish on time, Figure 1. 


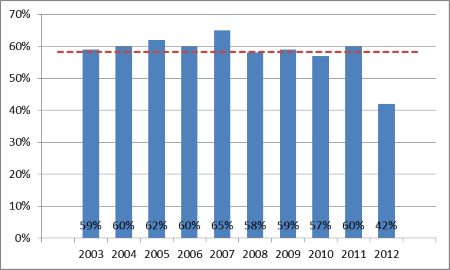
Figure 1.  Predictability Time - Construction

The production of a project schedule is the first step in project control.  In some cases, particularly on undemanding and straightforward projects, this initial planning and programming is sufficient and the project manager will be able to determine the status of the project without rigorous examination.  More often schedules are required to assist with the active management of time by regular monitoring, examination and modification.  Active management of time comprises three steps; Progress, Position, and Prediction, these are all relative to a point in time when the measurements or calculation are made; ‘time now’.  Without accurate measurement of progress it is not possible to establish the position of the project and without knowing the current status of the project, predictions about the completion of the project are likely to be little more than guesswork.  Without knowing when the project is likely to be complete it is impossible to determine what action must be taken to bring in the project on time.

Current Techniques

Progress – how much has been done

This is reasonably straightforward and usually involves assessment or calculation of the percentage of work completed on individual schedule activities.  Progress can also be attributed to the project as a whole but unless the project is relatively simple a single measure of how much of the project is complete is somewhat superficial.

Position – what is the current status

Position is usually stated as time ahead, on schedule or time behind and relates to an individual activity or the project as a whole is a comparison of where the activity, or project, is compared to where it was planned to be.  

For a single activity, assessment or calculation of position is also relatively straightforward. To calculate activity position:

if S  TN  F, then  if (% < 100, P = S + (D x %) – TN, else P = 0), else

if S  TN  F, then P = S + (D x %) – TN, else

if S  TN, then  if (% > 0, P = S + (D x %) – TN, else P = 0)

Where: P is the activity position,

S is the planned start of the activity,

F is the planned finish of the activity,

TN is time now,

D is the planned duration of the activity, and

% is the percentage complete of the activity at time now.

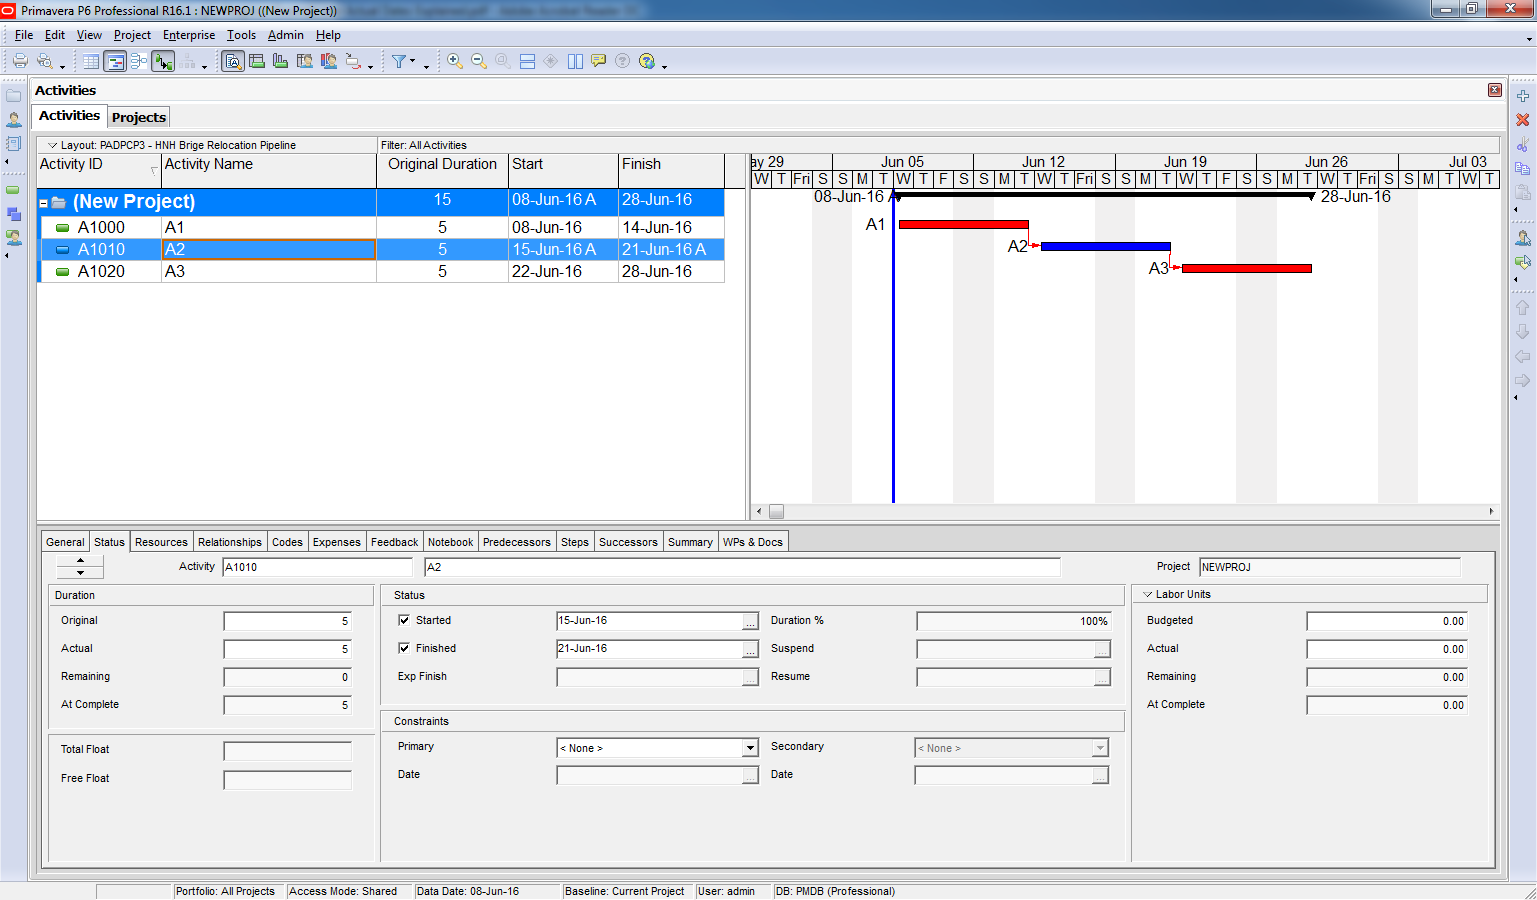
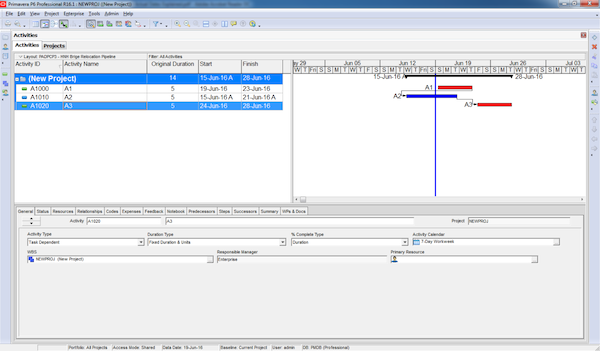
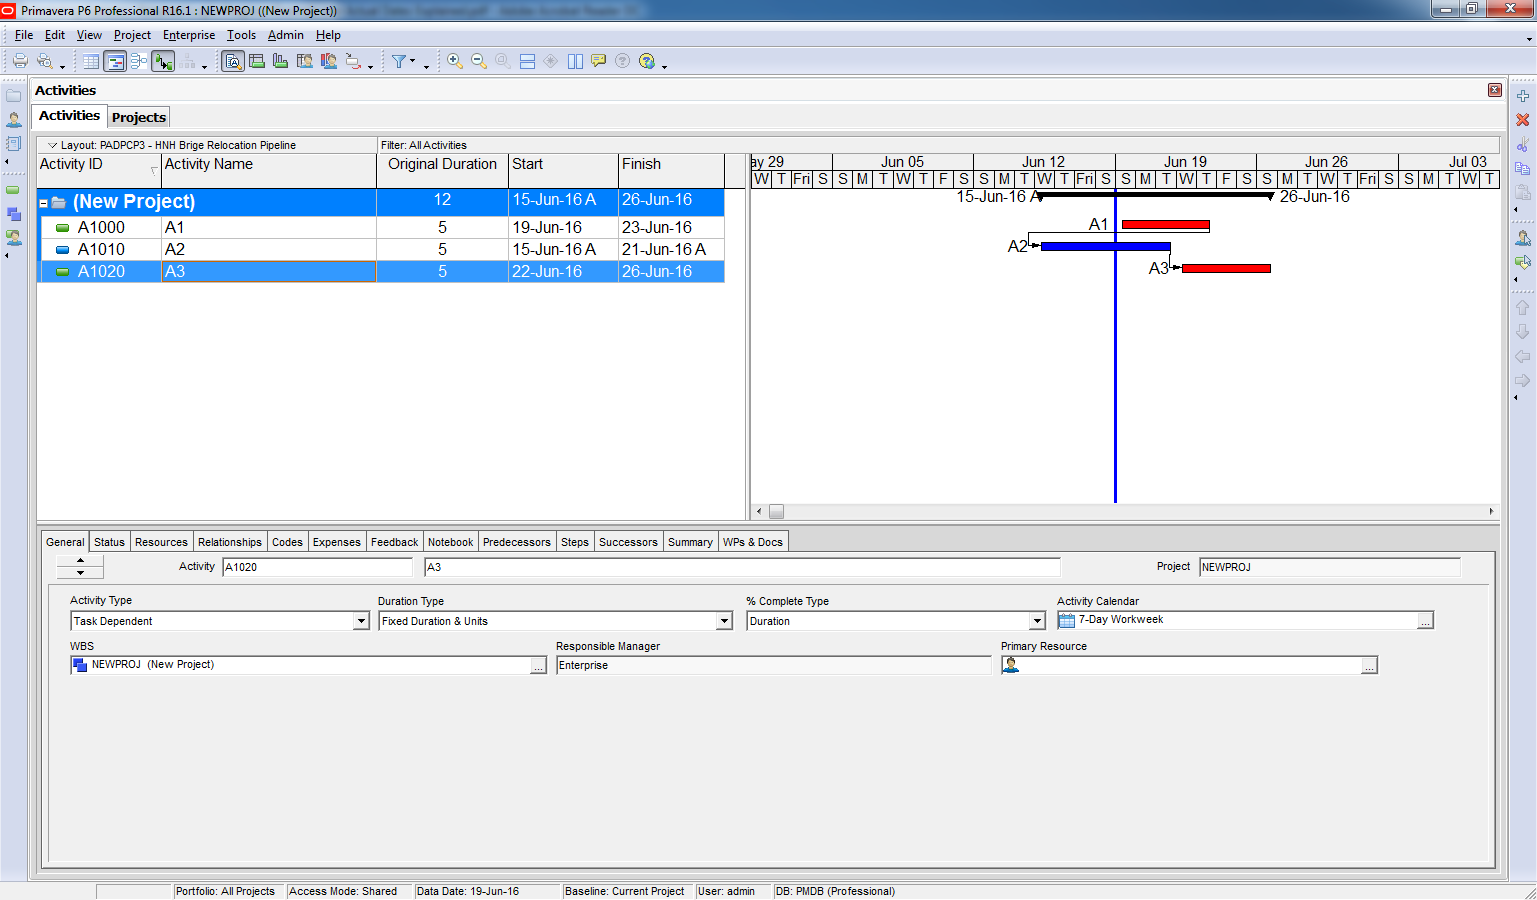
However, for a single activity, position is more readily demonstrated graphically using the bar chart ‘drop line’ method (see figure 2).


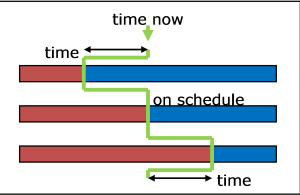
Figure 2.  Drop line activity progress and position

Determining the project position (or project status) accurately is more difficult.  Many project managers will use their skill, judgement and experience to assess the project position.  However, such visceral and subjective techniques are open to suggestion of bias and manipulation for commercial or other ends.

A number of objective techniques have been developed:

  • Averaging. This method averages the position of all the activities that are ahead or behind schedule.  Although simple and apparently reasonable this method is mathematically unsound.
  • Planned Progress Monitoring (PPM). This method compares the planned work content (based on activity duration) with that achieved.  This method does not depend on the schedule being a critical path network and is predominately the underlying method adopted to ‘roll up’ progress in summary and expanded type bars of project management software. 
  • Critical Path Methods. When the progressed project is rescheduled with the variance in the end date of the project can be interpreted as the project position.  This method depends on a fully linked and logical network.
  • Earned Value Analysis (EVA).  The parameter SV (scheduled variance) is a measure of the current status of the project.  This is similar to standard cash flow analysis; income -v- expenditure or cash weighted PPM.

Prediction – when will the project end

Predicting is the estimation or forecasting of some future event or condition of the project as a result of the study and analysis of available data on the basis of observation, experience or scientific reason.  Generally this will relate to a project milestone and particularly a forecast of when the project will be complete.

By its nature the prediction of future events with any degree of accuracy is difficult.  Project managers tend to rely on their experience and analysis based upon the current position of the project and with the assistance of the project schedule will envisage, or more formally reassess, the schedule for the remaining work.  If the reason for delay in the schedule was merely unrealistic durations and sequences then updating and amending the schedule to predict the completion date may be viable.  Unfortunately the time taken to complete activities generally conforms to Parkinson’s Law and the Student Syndrome so, unless the underlying causes of delay are confronted, there is inherent risk of overrun of the reassessed schedule too.

The result of analysing a critical path network taking into account current progress is often erroneously referred to as a forecast of completion.  For instance, where the project is in delay the rescheduled end date of the project would be delayed, this will only be a forecast of the completion date if the uncompleted remaining work were to be carried out in accordance with the schedule.  It is more likely that if past work was not carried out in accordance with the schedule then, unless something changes, nor would future work.  As stated previously the result of rescheduling a network taking account of current progress is a measure of the project position.

EVA attempts to formalise the forecasting of completion of projects using the parameter EAC (Estimate at Completion).  The unnecessarily complex acronyms render the technique virtually unusable for all but the ardent enthusiast.  In relation to time alone the technique can be simplified using the rate of progress to date and the time outstanding on the original schedule; for example, see Figure 3.

Planned completion date = 22.0 (BACt)

Time now = 12.0 (BCWSt)

Current position = 10.0 (BCWPt)

Rate of Progress = 10.0 / 12.0 = 0.83 (SPI)

Time not yet completed=22.0 – 10.00=12.0

Forecast time to complete = 12.0 / 0.83 = 14.5 (ETCt)

Forecast completion date = 12.0 + 14.5 = 26.5 (EACt)


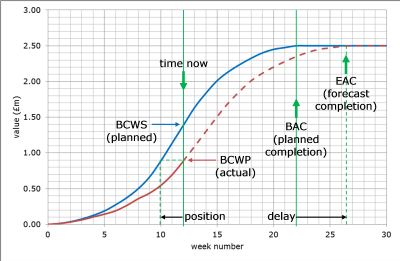
Figure 3.  Forecast completion using Earned Value Analysis

Whilst the estimated completion date can be calculated, plotting of the remaining forecast to completion curve is problematic, but without it, it is difficult to envisage the remaining progress of the project and to determine if future work is proceeding to the forecast plan.  In his booklet ‘EVA in the UK’, Steve Wake says:

The estimates to complete can be plotted (or hand-drawn by “experienced professionals”). …

The prediction of potential EACs (Estimates at Completion) has become increasingly accurate by using performance statistics from similar projects.  These statistics become templates that are overlaid onto the existing cost curves of a project and provide an independent and objective estimate of the final cost and completion date.  Something that everyone is interested in.

Blythe and Kaka take a different view and appear to suggest that advanced mathematical modelling is required (or at least beyond the capabilities of most project managers) and that the accuracy of the models is questionable:

There have been many attempts in the past to develop cash flow forecasting models.  They were mainly part of more comprehensive models aimed at assisting contractors or clients forecast their cash flow on an individual project level or on a company level.  The majority of these models were based on the idea of developing standard S-curves to represent the running value or cost of different types of construction projects.  Typically this was achieved by collecting data relating to the monthly valuations and the projects’ general characteristics.  These projects would then be classified and distributed into groups and average S-curves would then be fitted on the individual groups.  Several mathematical models were used to fit the S-curves (e.g. alpha-beta cubic equation, Weibull function, DHSS model etc.).  These models could be used, given that the total value and duration of the projects to be constructed are known, to forecast the cumulative monthly (or at any other time interval), value/cost of that project.  The accuracy of these previous models is in question.

Using PPM similar shaped graphs to EVA’s BCWS and ACWP for planned progress and actual/as-built progress are generated.  Whilst PPM is a useful method for determining the position of a project the s-curves that are typically produced are not easy for most practitioners to assimilate and to use for forecasting, see Figure 4.

Extrapolating the rate of progress, planned compared to actual at ‘time now’ can be used to predict the project completion date without the need for considering EVA or PPM. The only data require is the original project duration (D), the project position (P) and the ‘time now’ date (TN).  The forecast completion date is:

Completion = D x TN / P

Using the previous example:

= 22 x 12 / 10 = 26.4


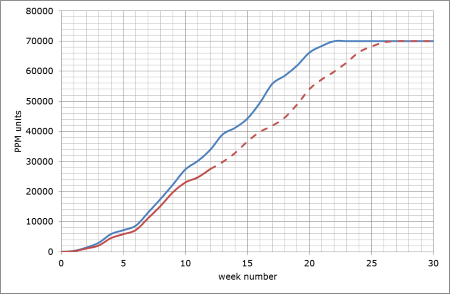
Figure 4.  PPM - planned, actual and forecast curves

The Proposed Method – Simple Linear Regression

Statistical analysis of project data has, up to recently, been the preserve of the financial analysts, be they corporate accountants or project accountants.  The data produced, when graphed, tends to resemble an s-curve.  As described previously, in connection to EVA, it is not easy to estimate the path of a partially completed curve.  It is possible, theoretically at least, to assign a mathematical formula to most curves but these can be extremely complicated (at least for the layman) and there is no certainty as to the shape, and hence formula, of that a predicted curve will, or should take.

The data for the graph at Figure 3 was based on SPI of 0.8 and further randomized on a monthly basis between 80% and 120% to model variances in progress.  The graph at Figure 5 illustrates the difference between the forecast data (from Figure 3) and the modelled ‘actual’ data.  The forecast completion is 27.6 months which is very close to 27.5 months that would be expected for a 22 month project (22/0.8).  Whilst this apparent accuracy is as much to do with the coincidence randomness of the data it illustrates the primary flaw in SPI type forecasts that they use a single data point as the basis for extrapolation rather than a longer term trend.


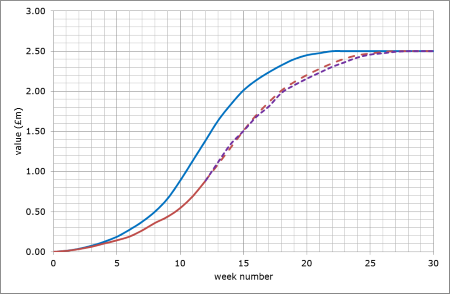
Figure 5.  EVA - forecast and actual

To overcome this weakness and the limitations of projecting unsystematic curves the method described below is based upon simple linear regression and time series analysis.  Whilst the components of the method are not novel the author is not aware of it being used to forecast project completion, particularly at least in the UK construction and engineering industry.

The planned model

The position of a project is usually stated as being ahead, on schedule or behind but it can also be stated as the number of schedule weeks achieved.  For instance, a project at week 20 which is 2.5 weeks behind schedule can be said to have achieved week 17.5, similarly a project at week 20 that is 2.5 weeks ahead of schedule can be said to have achieved week 22.5. The importance of the proposed method is recognising that for all projects there is a simple straight-line relationship between the planned position of a project and project time such that, for instance, at week 20 the project is planned to have achieved week 20.  The planned position line for all projects will be a ’45 degree’ line which straightens at the project completion date; see Figure 6.  In terms of EVA the planned line is similar to the BCWS curve.


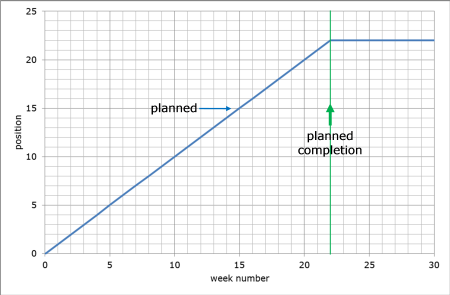
Figure 6. The actual/as-built model

The data for the actual/as-built model (BCWP in EVA parlance) is generated by calculating the project position by whatever method is appropriate as outlined above.  It is not recommended that different methods of determining the project position are used for each period but it may be good practice to generate multiple datasets based on different methods of calculation which then may give a range of estimates of project position.

The actual/as-built position data can then be plotted against the planned data; see Figure 7.  As the planned model is based on a straight line it is easier to appreciate the deviation of the actual position compared to the planned position.


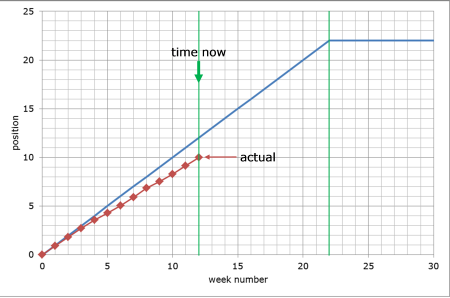
Figure 7. The actual/as-built model

The forecast model

The forecast of completion is made on the premise that, if nothing changes, if progress carries on in the future as it has in the past, the project completion date will be thus.  Previous forecast models have used a single data point; the last measured project position.  However trends are not absolute and there is likely to be some waxing and waning, positive and negative deviations from the general trend.  Using the last measured progress position may exaggerate or understate the general trend.

As the planned position is based on a linear model it is acceptable to consider that the actual model, unless it is subject to wild fluctuations due to specific delaying events, will also follow a linear trend and hence forecast can be made using simple linear regression which will take account of all the past progress not just the last project position.

Figure 8 shows the simple linear regression line plotted for the actual project positions.  The linear equation enables the trend line to be extended to the completion position (month 22) and for the date to be calculated, in this case 26.62 months.


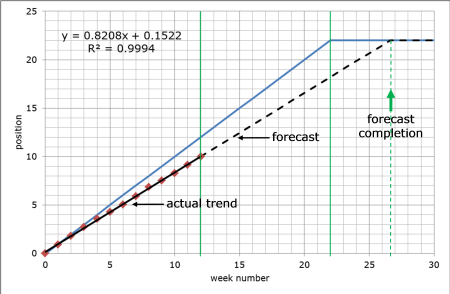
Figure 8.  The forecast model

The position trends are easier to assimilate as straight lines and progress and trends, should future performance match past performance, can be readily seen as can  changes in progress required if the project is to not lose any further time or to be completed on time, see Figure 9.  It is submitted that such trends are not readily accessible using s-curves.


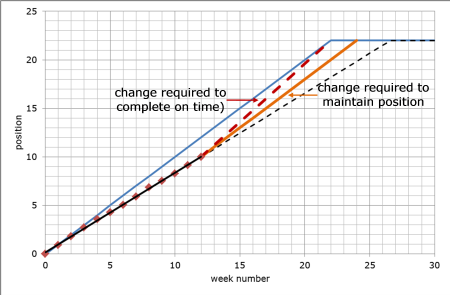
Figure 9.  Change required

Most emphasis in this paper has been on projects that are behind schedule. Figure 10 shows typical regression plots for projects that are on schedule and for projects that are ahead of schedule.

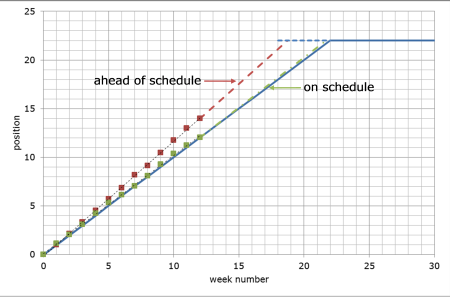
Figure 10.  Ahead and on schedule

Conclusion

Forecasts of completion dates are almost always wrong.  Forecasting completion of projects is not about estimating when a project will be complete but more about when it will be complete if progress continues in the future at the same rate that was achieved in the past.  Only by knowing what the potential overrun (usually) will be if nothing changes can the project manager determine what needs to be done to bring the project back on schedule.  The reason forecasts are wrong is that, hopefully, project managers will have taken steps, with the knowledge of the effects of doing nothing, and have pulled the project around.

Current methods of forecasting completion mostly depend on extrapolating the last known project position to forecast project completion.  Earned Value methods also use a single position measure but depend on s-curves to illustrate the work flow. S-curves are difficult to assimilate and difficult to mathematically predict.

The proposed method depends on simple linear regression taking account of all the position data and presenting it in simple straight-line graphs that are more readily understood by non-specialists.  Trends are easier to understand and the amount of action to bring the project back on schedule is straightforward to see.

Like all current methods of forecasting, including earned value methods, specific and exceptional delaying events can skew the forecast.  Progress trends tend to be influenced by leadership, management, resources, experience and strategy decisions.

Acknowledgements

Anneka Wilson, Driver Group’s Group Marketing Executive has been constant with her help and encouragement even though, like most planners, I have always been behind schedule.

My colleagues at Driver Group; Stephen Lowsley, Keith Strutt, David Wileman, Philip Allington and Janus Botha have provided technical critique of my paper – any errors, however, remain mine.

Dr Chris Chatfield of the Department of Mathematical Sciences at the University of Bath and author of ‘The Analysis of Time Series: An Introduction, Sixth Edition’, kindly took time to reply to my emails and responded to my very basic time series questions.

Whilst every effort has been made to ensure the accuracy of the information supplied herein, Driver Group plc, its subsidiaries and the author cannot be held responsible for any errors or omissions. Unless otherwise indicated, opinions expressed herein are those of the author and do not necessarily represent the views of Driver Group plc and/or its subsidiaries.

The author warrants that he is the copyright owner and that all sources are acknowledged and referenced and that as far as it is possible to ascertain this work does not infringe any existing copyrights.

All rights reserved. No part of this document may be reproduced or transmitted in any form or by any means, electronic, mechanical, photocopying, recording, or otherwise, without prior written permission the author or Driver Group plc.

Continue reading
4866 Hits
0 comments

Where does BASIC Engineering stops?


A recurring question asked about the Engineering process is the frontier between BASIC and DETAIL Engineering. Engineering design is indeed a continuum and one may wonder to what level of details corresponds the BASIC Engineering.

This question finds its answer while considering the purpose of BASIC Engineering, which is define the facility to high enough a level of details so that

1)      contractors can estimate the costs for the EPC execution of the facility with enough accuracy to submit a lump sum bid,

2)      the documents define the facility in enough details to secure a certain standard of quality in design, materials and workmanship for the Owner

It is in both the owner and the contractor’s interest that the plant is as well defined as possible at BASIC Engineering stage.

This is rather obvious for the EPC bidder, in order for him to properly assess its costs and the required resources. An insufficiently developed BASIC engineering is likely to show quantities significantly inferior to the actual ones. This may lead to an underestimated cost and resources allocation by the EPC Contractor. This will create a strain in the project execution, as contractor will exceed its budget or will not have planned and mobilized sufficient resources.

An ill defined BASIC engineering will also lead to a large number of changes in EPC phase, which will generate delays in Engineering, extra costs etc.

The owner will also benefit from a well defined BASIC Engineering, as its requirements will be precisely defined, ensuring compliance by contractor.

One could think, however, that a too high level of details in the Engineering basis of a lump sum EPC contract could be detrimental to the owner. A precise definition at an early stage is very likely to require numerous changes as design develops later on. The EPC Contractor could then claim extra costs for such changes to what he bid for.

Let’s consider a facility whose BASIC Engineering package included drawings of its equipment supporting structures. As the piping routing and location of manifolds, instruments, filters etc. will not have been developed as this stage, the structure will most probably lack floors to accommodate these equipment while providing access to the operator. Should drawings of these structures be issued at BASIC engineering stage, these floors will be missing. As these floors will prove necessary as design progresses, the EPC contractor may very well consider them as additions that were not quoted for. The EPC contractor could compare the final design (with operating floors) and that of the BASIC design and claim for the incremental cost.

To protect the owner against such risk, the EPC Contract includes a clause that specifies that the EPC contractor endorses the BASIC Engineering. This means that the EPC contractor takes responsibility for the content of the BASIC Engineering and forfeits its rights to claim for any change, including changes required due to design development, such as that the additional floors discussed above.

Although the higher BASIC Engineering is defined, the better it is for both parties, the Owner will want to limit its duration to launch the EPC as soon as possible. BASIC Engineering will therefore focus on a limited number of activities and deliverables.

First of all, a BASIC design package, that will form the Engineering basis of the EPC Contract, will contain generic documents, not specific to the particular facility being projected, but aimed at defining certain standards to the EPC Contractor for the design, materials and workmanship. These are the General specifications, usually that of the owner.

The general specifications will include specifications for the various types of materials and works.

The specific document describing the facility will come next, starting with the 3 most important ones, that almost by themselves nail down the price of the facility: the P&IDs, heat and material balance and General Plot Plan, to which could be added the Electrical One Line Diagram.

The Process and Utilities P&IDs along with the Heat & Material balance will set the duty of all process equipment.

The Plot Plan will set the overall dimensions of the facility and the distance between equipment, which will determine the length of all networks (piping, cables, roads, sewage etc.) directly impacting their supply and installation costs.

Once these are defined, BASIC Engineering, whose aim is to allow an accurate estimate of the cost of the facility, will focus on the definition of the most expensive pieces of equipment, whose data sheet and specification will be prepared in order to issue inquiry to vendors.

Installation costs will be estimated from Engineering list and MTO: The Project equipment list for equipment erection, the civil BOQ for earthworks, foundations, concrete and steel structures, underground networks and buildings, and the Piping MTO. Ratios, rather than precise MTO, will mainly be used by the estimator to evaluate the cost of E&I works.

Safety discipline will conduct the first HAZOP. Safety will issue its philosophies, including Fire Fighting & Protection, Fire & Gas detection, Human Factors etc. Safety will issue Fire Water P&IDs and data sheets of main Fire Fighting equipment. Hazardous area classification drawings will be issued. An ENVID (Environmental Identification) study will register all environmental aspects. No Quantitative Risk Assessment will be carried out at this stage, as required detailed data is missing.

Process will first of all develop the P&IDs from the PFDs and produce/update the Heat & Material balance. For inquiry purpose, Process will be required to issue Process data sheets of all main equipment and functional specifications of all main packages. All Process “philosophy” documents will be issued, such as the Process description and Operation philosophy, Emergency shutdown and depressurization philosophy. Cause & Effects diagrams will not be developed at this stage. Process will participate in the HAZOP of the BASIC design P&IDs. The Flare study will be limited to the identification of the largest relief case.

Specialist engineers in the various equipment disciplines (Rotating, Packages, Fires Equipment, Pressure vessels, Heat Exchangers) will issue the Mechanical Data Sheets, Inquiry Requisition and Technical Bid Tabulations after receipt of vendor bids.

Clarifications with vendors might take place for the vendors of major equipment however placing of Purchase Orders and vendor follow-up (review of vendor drawings etc.) will not take place at BASIC design stage.

Piping installation discipline will develop the General Piping Layout for main pipes, e.g. above 4”. The first Piping MTO will be issued, based on the later for length and P&IDs for item count. Construction drawings (Piping General Arrangement drawings and isometric drawings) will not be not developed at this stage.

Piping Material will issue the Piping Material Classes specifications as well as General specifications for the various types of Piping Materials (fittings, valves etc.).

Piping Stress will simply issue the criteria for the Piping stress calculations. No calculations or support studies will be done at BASIC stage.

The instrument engineer will specify the various systems to be provided. This will include the usual PCS, ESD, and F&G systems, for which specification, including I/O count, and architectural drawings, will be issued.

Other systems, such as a security system, advanced process control systems, telecom systems etc. will also be defined, by means of a specification, an architectural drawing and, for systems expanding throughout the field (e.g. security system), a General Layout drawing.

The data sheet of motorized valves will be produced, due to their cost. No other instrument data sheet will be produced.

No Material Requisition will be issued by the Instrument Engineer at BASIC Engineering stage. Cost will be estimated by the EPC contractor from data base and ratio, e.g. so much for each instrument, I/O etc.

Typical installation drawings will be issued. Although no cable routing will be issued at this stage, width of the main cable routed will be advised to the Piping Layout discipline for incorporation in the Plot Plan. Equipment arrangement drawings for instrumentation and control room will be issued as input data for civil discipline’s architectural drawings.

The Civil Engineer will issue the initial soil investigation specification, aimed at identifying the soil geotechnical parameters and any geo hazard. The specifications for the various types of civil works will be issued, together with the bill of concerned quantities. No drawings will be issued, neither calculations done, for any foundation or structure at this stage. Standards design drawings only will be issued. Building architectural drawings will also be produced..

The Electrical Engineer will not go beyond the General One Line Diagram. The One Line Diagram of switchboards will not be developed at this stage. The Electrical Consumers list will be produced, from which the Power requirement and the size of the power generators will be derived.

The Electrical Engineer will issue the specification, data sheet and inquiry requisition for the High and Medium Voltage equipment – the most expensive - only. Cable routing drawings will be limited to the Main routings only, allowing to allocate required space on the Plot Plan and to define cable lengths and issue the cable MTO. Standard drawings related to design, i.e. equipment, only will be produced at this stage. Installation standard drawings will be developed at DETAIL stage. Equipment arrangement drawings will be issued for electrical sub-stations as input data to Civil’s architectural drawings.

Painting, Coating etc. specifications may also be issued, especially where onerous requirements apply, e.g., coating of underground pipes etc.

Continue reading
6420 Hits
0 comments

How does Retained Logic, Progress Override and Actual Dates in Scheduling Options work?


In P6 there are three options in the Scheduling Options dialog:

  • Retained Logic
  • Progress Override
  • Actual Dates

1

These three options control how P6 calculates “Out of Sequence Progress”.

We have a simple project with 3 activities:

The activity logic dictates that A2 should not begin until A1 has been completed, but in the real world sometimes A2 can be started and finished even though A1 has not been started – this is known as Out of Sequence Progress.

So, how is P6 handle this case. It depend on which option you choose.

Scheduling using the Retained Logic option:

The logic of the activity is retained and enforced, and so Activity A3 cannot be started until activity A1 has been completed, as shown below.

Scheduling using the Progress Override option:

The out of sequence progress overrides the logic of the activity, and so activity A3 is scheduled independently of the predecessor of A2. In other words, activity A1 is no longer considered to be a predecessor of activity A3.

Scheduling using the Actual Dates option:

When scheduling the project using the Actual Dates option, the actual dates override the logic of the activity, and so activity A3 is scheduled to begin as soon as activity A2 is complete, even if activity A2 has an actual finish date after the data date.

So now I hope you know how to use those 3 options.

Continue reading
2991 Hits
0 comments

How much detailed is DETAIL Engineering?


 Building detailed design is not usually developed by the EPC Engineer, which merely defines its needs to the building construction contractor.

The EPC Engineering produces guide drawings, which will include:

   • Architectural drawings, showing all dimensions of the buildings, the dispositions of rooms, as defined by the concerned discipline (Mechanical for a building housing machinery, E&I for technical rooms etc),

  • Equipment dimensions and weight, for the design of supporting floors,

  • Equipment access requirements (size of doors, handling),

  • Building blast resistance requirement,

  • Cable entry requirements: raised/false floor, floor openings,

  • Climate requirements (temperature etc), and equipment heat dissipation,

  • Fire & Gas detectors and equipment layout,

  • Telecom equipment layout (LAN etc.),

  • Tie-in points for connection of the building to the PLANT’s utilities.

 The structural design, calculations and all structural drawings for the building and its foundation will be done to the civil contractor. So will the HVAC detailed design (equipment selection, flow diagram, ductwork routing), Fire & Gas and Telecom cable routing, design of the lighting and small power, plumbing networks, finishing schedules (doors etc.) etc.

The latter will particularly entail co-ordination all these trades, to avoid interferences.

The rationale for the EPC contractor to leave the building detail design to the construction contractor is that it has little cost impact and is time consuming. The EPC engineer’s always stretched resources concentrate on either critical or high cost items.

For On-shore Steel structures, such as pipe-racks etc, the EPC Engineer will perform the design, calculation and sizing of the members but no detail any further. Its work will stop at the issue of the Steel structure design drawings, such as the one shown on page 84. These are "on-line" drawings, indicating of the size of profiles, dimensions & elevations.

Connections between steel members, in particular, will not designed/sized by the EPC Engineer but left to the steel structure fabricator. The EPC contractor will simply provide the latter typical drawings, design criteria and individual loadings. The steel structure fabricator will perform the sizing of the connections and produce the corresponding calculations note and detailed drawings.

The fabricator will also produce all drawings used in fabrication (shop drawings) and erection. See samples shown on pages 85 and 86.

In Piping, the level of details to which the EPC Engineer goes is very high, with the issue of the Piping Isometric drawings. The latter are nevertheless not directly used for construction. Indeed, these are "Design" Isos, to which fabrication information (indication of welds following split in spools) must be added. Spooling, resulting in the issue of Shop Isos, is done by the piping construction contractor. Difference between Design and Shop isos are shown on page 114.

While leaving design work to the construction sub-contractors, the EPC Contractor must ascertain the latter’s design office resources and capability. Early follow-up of production of the latter (through put and quality) will allow early identification and mitigation of a bottleneck.

Continue reading
6482 Hits
0 comments

Categories

Search

Australian Open Learning Pty Ltd t/a Project Controls Institute, Australia | RTO CODE :45806